Tesla Technical Analysis
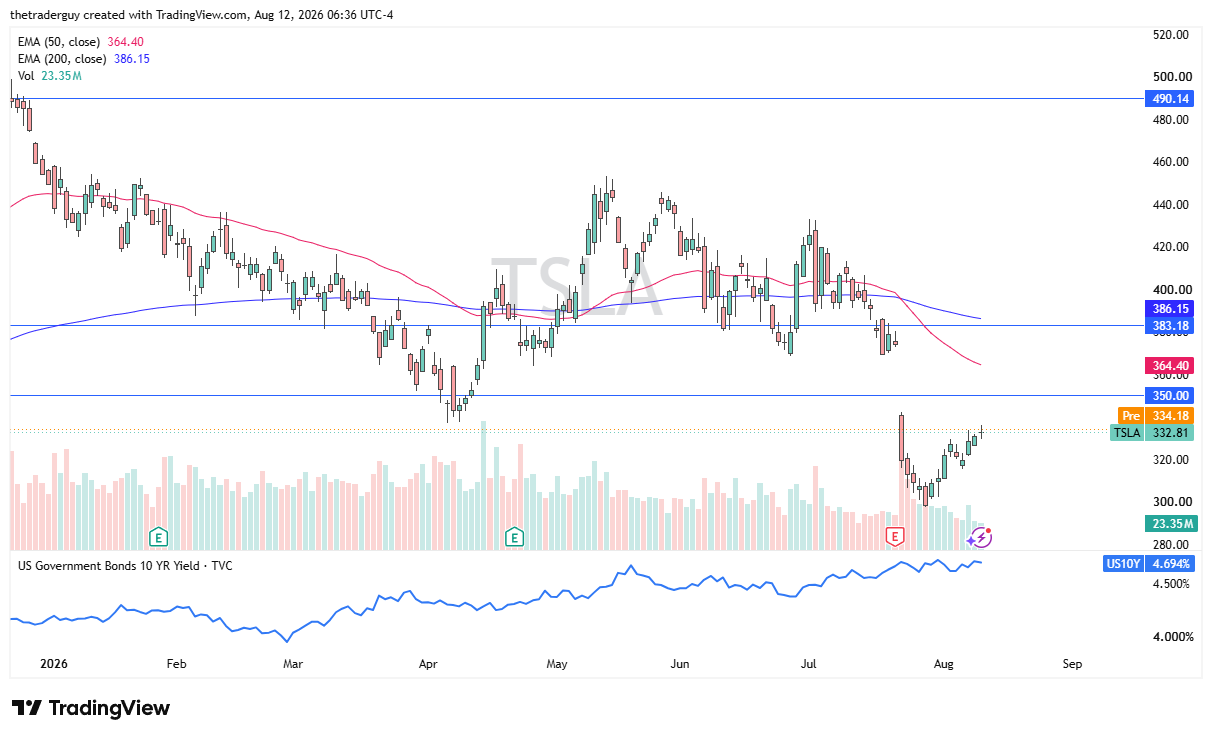
The early pre-market trading for Tesla is a bit quiet. It certainly looks as if we are going to be struggling here to continue to the upside. The market has a massive gap just above that could offer a bit of resistance from a technical analysis standpoint. But it is worth noting that we have, in fact, bounced quite nicely from the $300 level. Ultimately, the $350 level was a previous support level. It could end up being resistance as well.

General Motors Technical Analysis
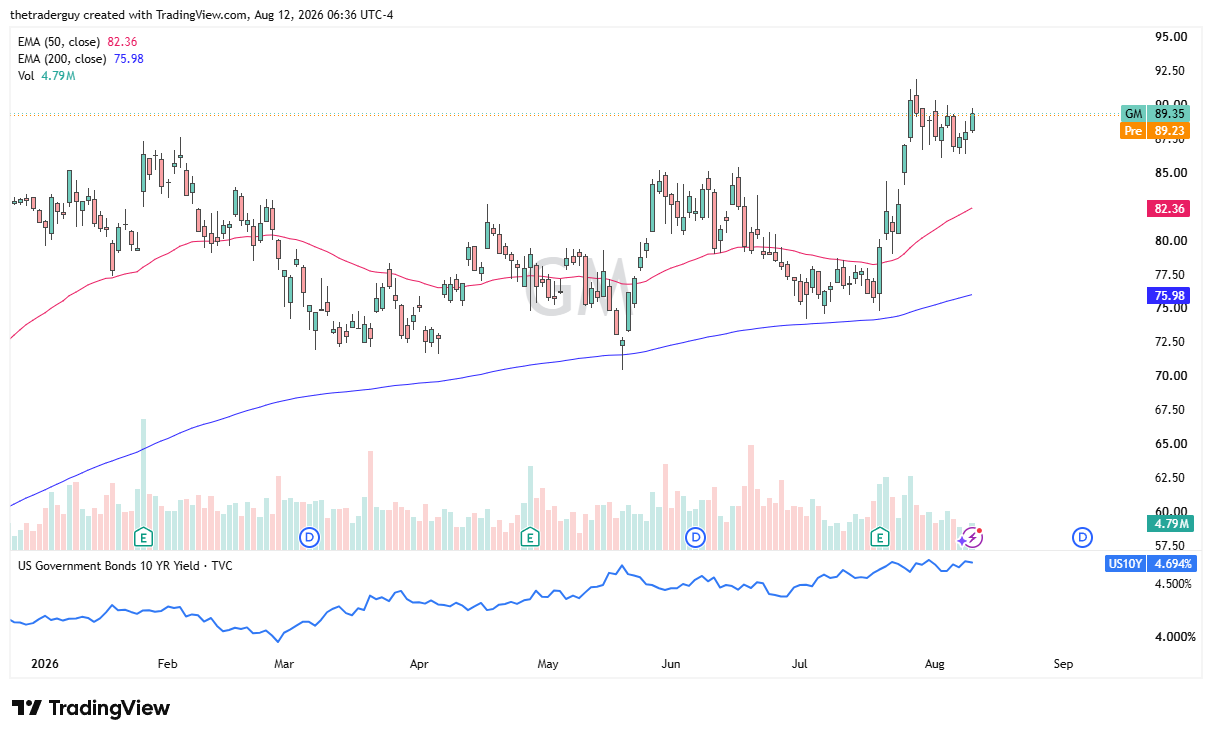
The General Motors market looks a little bit quiet in pre-market trading as well. But General Motors has formed a massive bullish flag as of late. And that offers technical traders a little bit of hope. If the market were to break the top of this flag, the measured move could be for roughly $15. That would put GM at about $105 a share. We’ll see whether or not that happens, but, of course, this pattern is something that technical traders will be watching very closely because it is so obvious.
Ford Technical Analysis
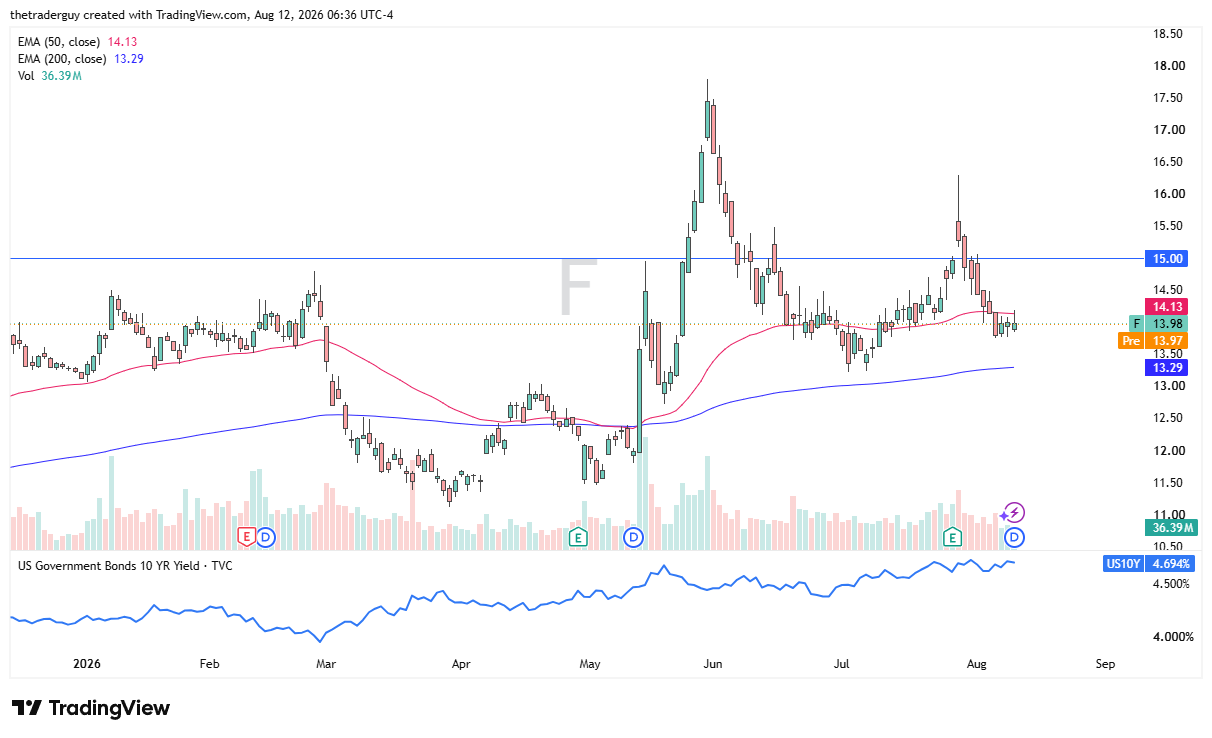
Ford looks pretty flat at the open. It’s recently been negative followed by sideways action. It looks like Ford is struggling with the 50-day EMA. Ultimately, this is a market that if it can break to the upside, it would more likely than not just look very range-bound from the last couple of months. We do have an ex-dividend date today, so that may or may not come into play. Recently, we’ve had fairly decent earnings, but a pullback. Ultimately, this is a very range-bound market, kind of steady as she goes.
If you’d like to know more about technical analysis and how traders use it, please visit our educational area.