
US Dollar News: Weak Payrolls Shift Focus onto CPI
The U.S. dollar starts the week from a drastically changed fundamental position after Friday’s U.S. employment report showed that nonfarm payrolls decreased by 23,000 in July. The unemployment rate was unchanged at 4.1%, while the total nonfarm payrolls for May and June were revised down by a total of 103,000. Average hourly earnings increased by 3.2% year over year, but the labor-force participation rate decreased to 61.4%, and the report added to the evidence that the momentum in employment is slowing.
This is a sign of a weakening economy which has dampened expectations for a round of Fed rate hikes. Investors are analyzing this week’s July CPI report. Analysts predict a core inflation increase of 0.2% month-over-month and an annual increase of 2.5%. If the report is a ‘soft’ reading, it will indicate the Fed will choose to remain passive and hold rates. Aggressive report revisions in the Fed’s direction, especially in the case of renewing inflation in the energy sector, would be problematic for that assessment.
The Euro is caught up in another type of divergence. In July the ECB held the deposit rate at 2.25% following a June hike. The ECB is convinced we have not yet experienced the full inflationary cascading effects of the Middle East energy shock. The ECB is committed to evaluating data and the current energy crisis has the potential to trigger a second wave of inflation.
The Pound is experiencing the same inflation and growth issues as the Euro. The Bank of England decided to hold the BoE’s rate at 3.75% on July 30. In the UK inflation is currently running at 2.6%. The BoE expects inflation to remain high in the UK as energy inflation continues to filter through the economy. As a result, the Pound is experiencing an increasing amount of volatility.

U.S. Dollar Index Technical Analysis: DXY Holds $99.42 Support but Trend Remains Fragile
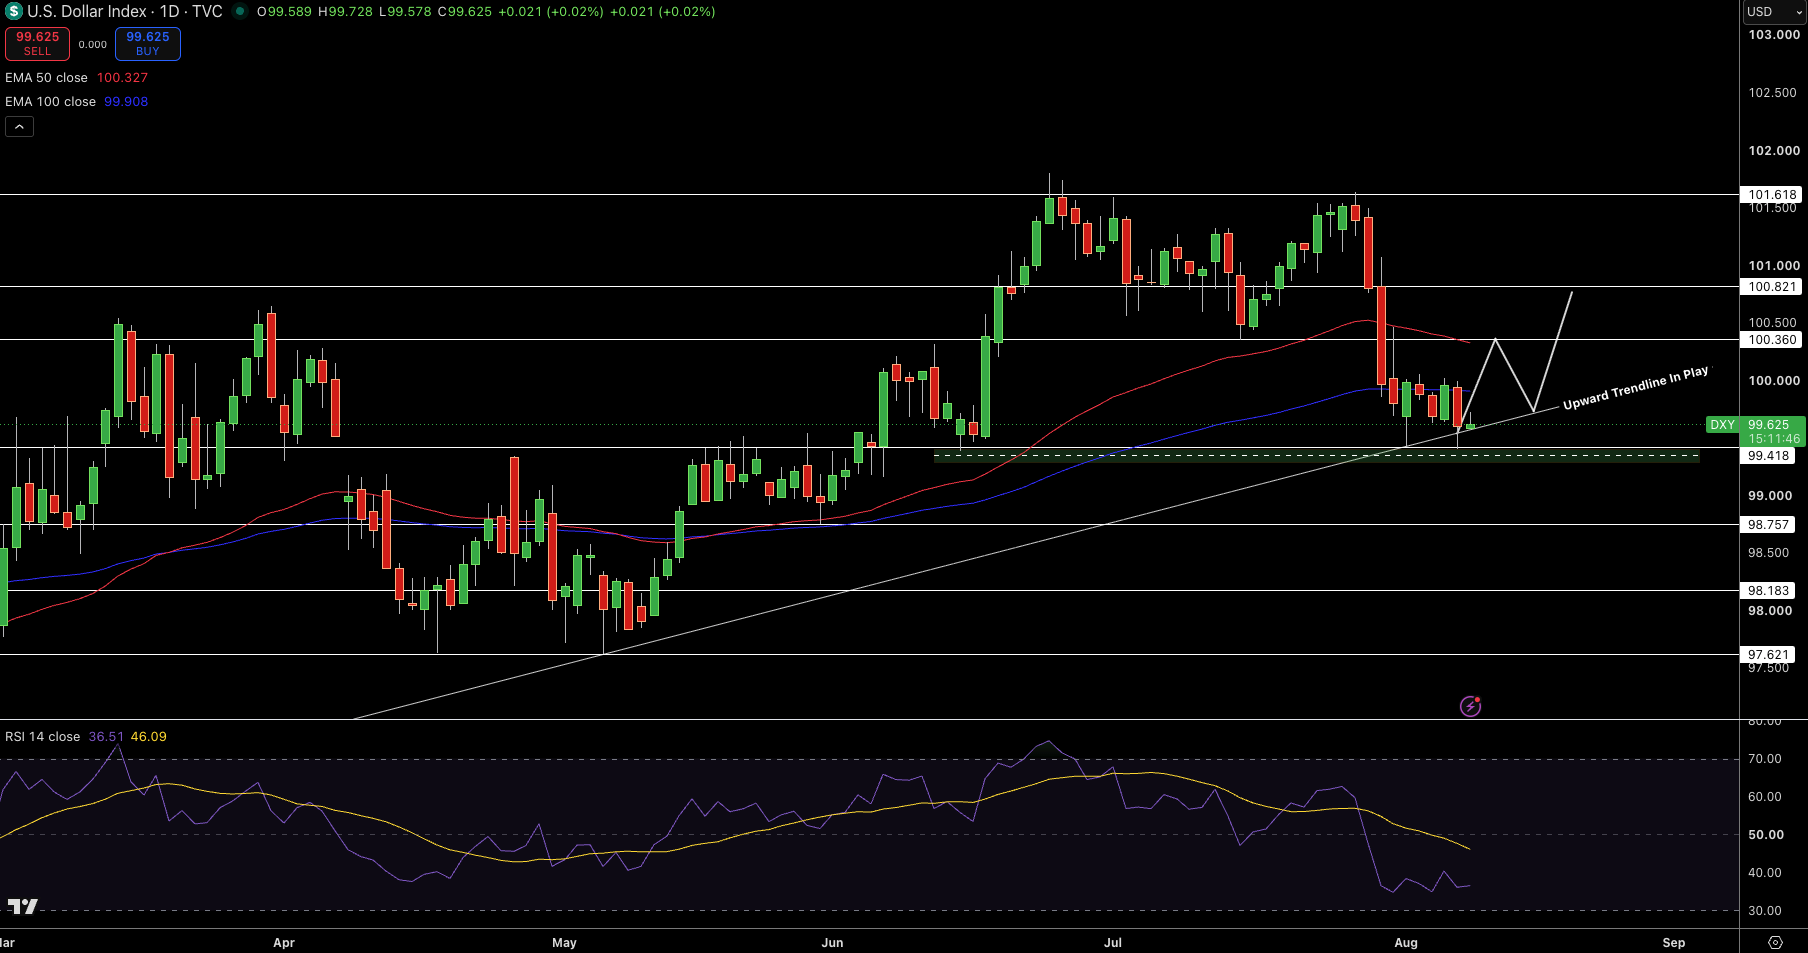
Currently, the U.S. Dollar Index is showing a quotation of $99.63. After the most recent sharp sell-off, it has been able to defend a long-term rising trendline and the key support zone of $99.42. The price is under both the 50-day EMA at $100.33 and the 100-day EMA at $99.91. This is keeping the broader short-term structure at risk, even after the most recent consolidation.
The most recent price action has shown smaller bodies of the candlesticks with respect to support, showing the momentum for selling is diminishing, but with no signs of a reversal. The RSI is currently at 37. It is close to the oversold region, meaning that there is a possibility of a technical rebound.
The first line of resistance is at $100.36, with subsequent resistance at $100.82 and $101.62. If the trendline holds, the move will reach towards those levels. If support at $99.42 is broken, the new targets will be $98.76 and $98.18.
EUR/USD Price Forecast
Every new EUR/USD analysis as it publishes, today's technical signal and key levels, live price — on one page.
See all EUR/USD forecastsGBP/USD Technical Analysis: Sterling Holds Rising Trendline Below $1.3510 Resistance
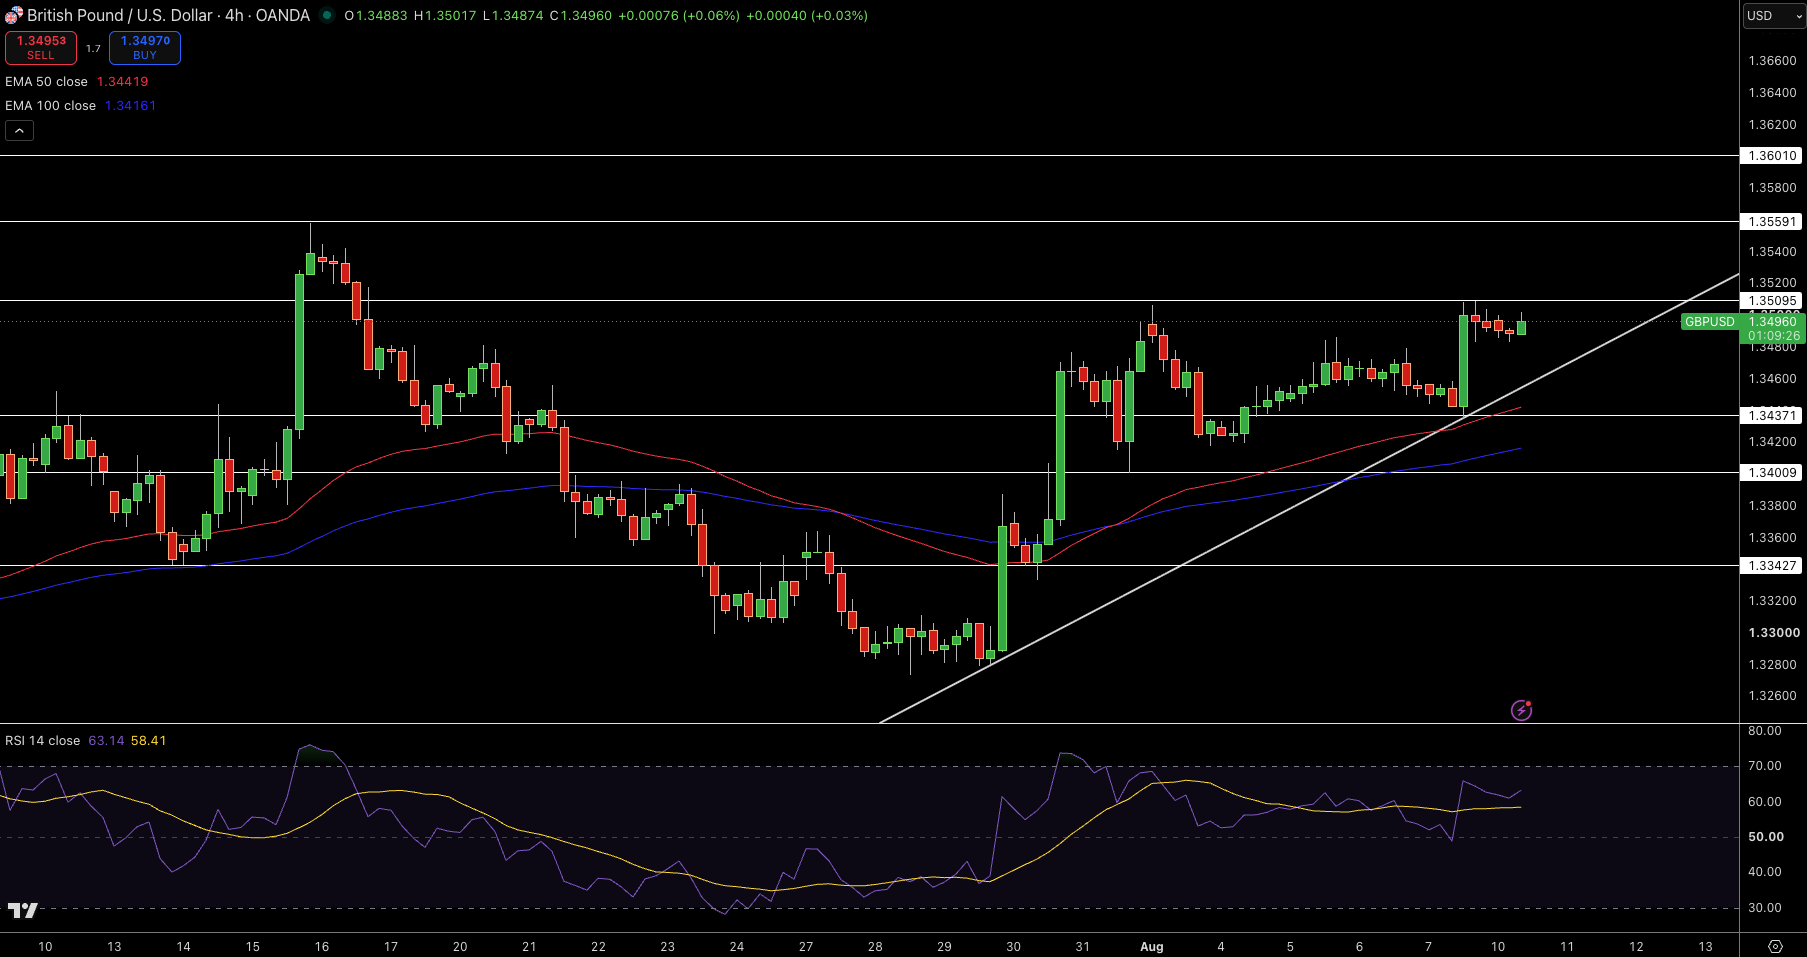
GBP/USD is currently trading at $1.3496. The pair is currently above a trendline and is above the 50 EMA ($1.3442) and 100 EMA ($1.3416). Recent candles show that buyers are protecting the higher lows while the resistance at $1.3510 is being tested. At 63, the RSI shows a bullish trend with no signs of being overbought.
Resistance is at $1.3510, $1.3559, and $1.3601. Support is at $1.3437, $1.3401, and $1.3343. The trend is positive while GBP/USD is above the cluster of moving averages and the trendline. A break of $1.3510 would target $1.3559, and a break of $1.3437 would change the trend to bearish.
EUR/USD Technical Analysis: Euro Presses Long-Term Trendline Near $1.1560
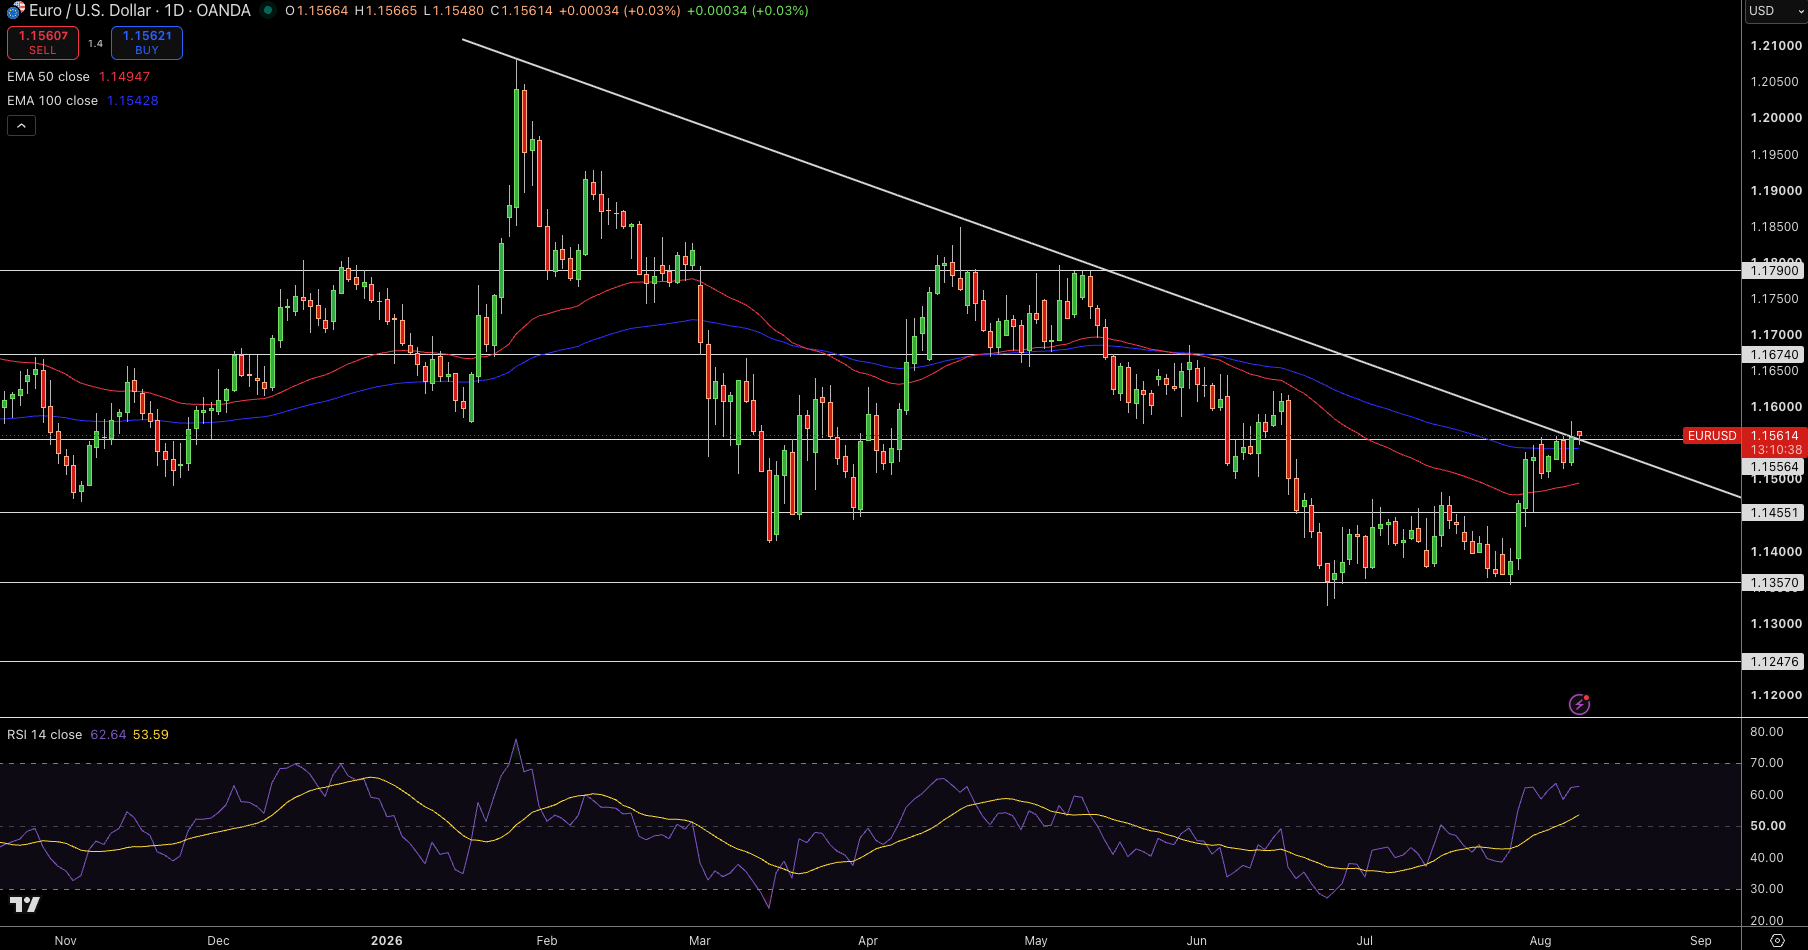
EUR/USD is currently at $1.1561, approaching a long-term bearish trendline that downwardly intersects with price. The currency pair is currently trading above the 50-day EMA at $1.1495 and above the 100-day EMA at $1.1543, which suggests that momentum is headed in a bullish direction. This is a positive shift, given price action from previous months. EUR/USD has been in a bullish trend but is facing resistance.
The RSI is bullish, but has not entered the overbought territory, with a current value of 63. The levels of resistance are currently at $1.1560, $1.1674 and $1.1790. The first level of support is at $1.1455, with the second level at $1.1357.
An extended close above $1.1560 would indicate a higher price trend in the coming weeks. If the bearish trendline is again respected, short term price action will trend toward $1.1455.