
US Dollar News: Payrolls Countdown and Global Central Banks Shape FX Outlook
The U.S. dollar’s value continues to fluctuate in anticipation of the U.S. Nonfarm Payrolls (NFP) report, the final significant market mover before all the markets take another look at the Federal Reserve’s overall policy outlook. Focused on NFP, is the most derived initial assessment of the potential impact on U.S. labor markets. A positive U.S. Nonfarm Payrolls report, coupled with positive detailed U.S. labor market employment data, will reinforce the viewpoint that the U.S. Federal Reserve will adopt a more accommodating monetary policy stance later this year. Based on the latest Reuters real-time reporting, markets are now primarily focused on U.S. labor market data after last week’s Federal Reserve meeting.
The U.S. dollar is stabilizing following Friday’s European Central Bank meeting in which it kept its main interest rate on overnight deposits at 2.25%, and repeated its data-dependent stance. Investors are now waiting on German industrial production and eurozone retail sales statistics, all of which will give insight into the potential for a recovery in domestic demand within eurozone countries, particularly in light of the first part of the year being subdued. In their recent meetings, various policymakers have continued to underline the fact that inflation is approaching the European Central Bank’s target of 2% and that further tightening of eurozone monetary policy appears to be warranted; although, at this juncture still may be upside risks to be concerned with.
Sterling is digesting last week’s Bank of England decision. Bank Rate was left at 3.75%. Investors are anxious to see what new data will show about the UK economy. In the lead up to this data, investors will be studying data related to labor market activity, consumer spending, and business activity, to get insight on whether easing inflation is sustainable without a sharper slowdown in growth. Alongside the collection of domestic indicators, early Friday’s U.S. payrolls report will remain the major driving force behind foreign exchange sentiment for the week ahead.

US Dollar Index (DXY) Technical Analysis: Dollar Index Tests Trendline Support Below 100.00
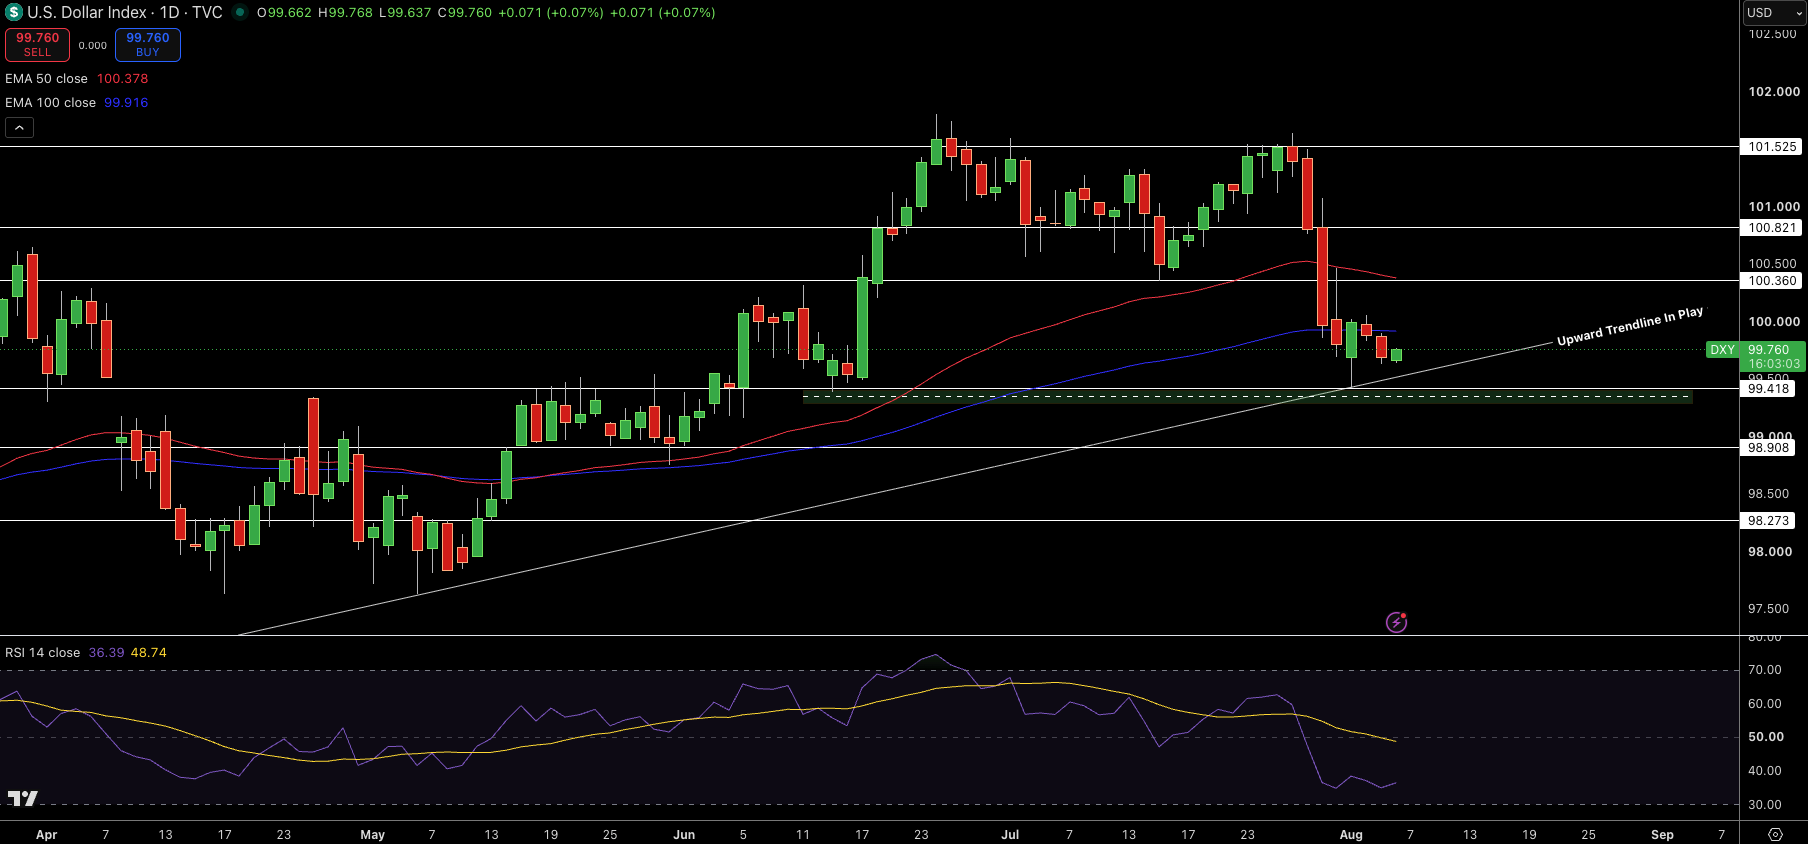
The US Dollar Index (DXY) continues dropping, currently trading at 99.76. It has been harshly rejected by 101.52, and has dropped below the psychological 100.00 zone and is currently challenging a key ascending trendline that can be found at 99.42. The index currently sits below the 50-day EMA ($100.38) while just holding above the 100-day EMA ($99.92), reflecting diminishing bullish sentiments. RSI has fallen to 36, moving into oversold territory, indicating that downside price momentum is losing speed.
A decisive break below 99.42 would expose 98.91 and 98.27, reinforcing a bearish outlook. However, if bears defend the trendline, the DXY could stage a recovery toward 100.36 and 100.82. For now, the larger bias remains cautiously bearish while the index trades below 100.00.
GBP/USD Technical Analysis: Sterling Consolidates After Strong Recovery Toward $1.3500
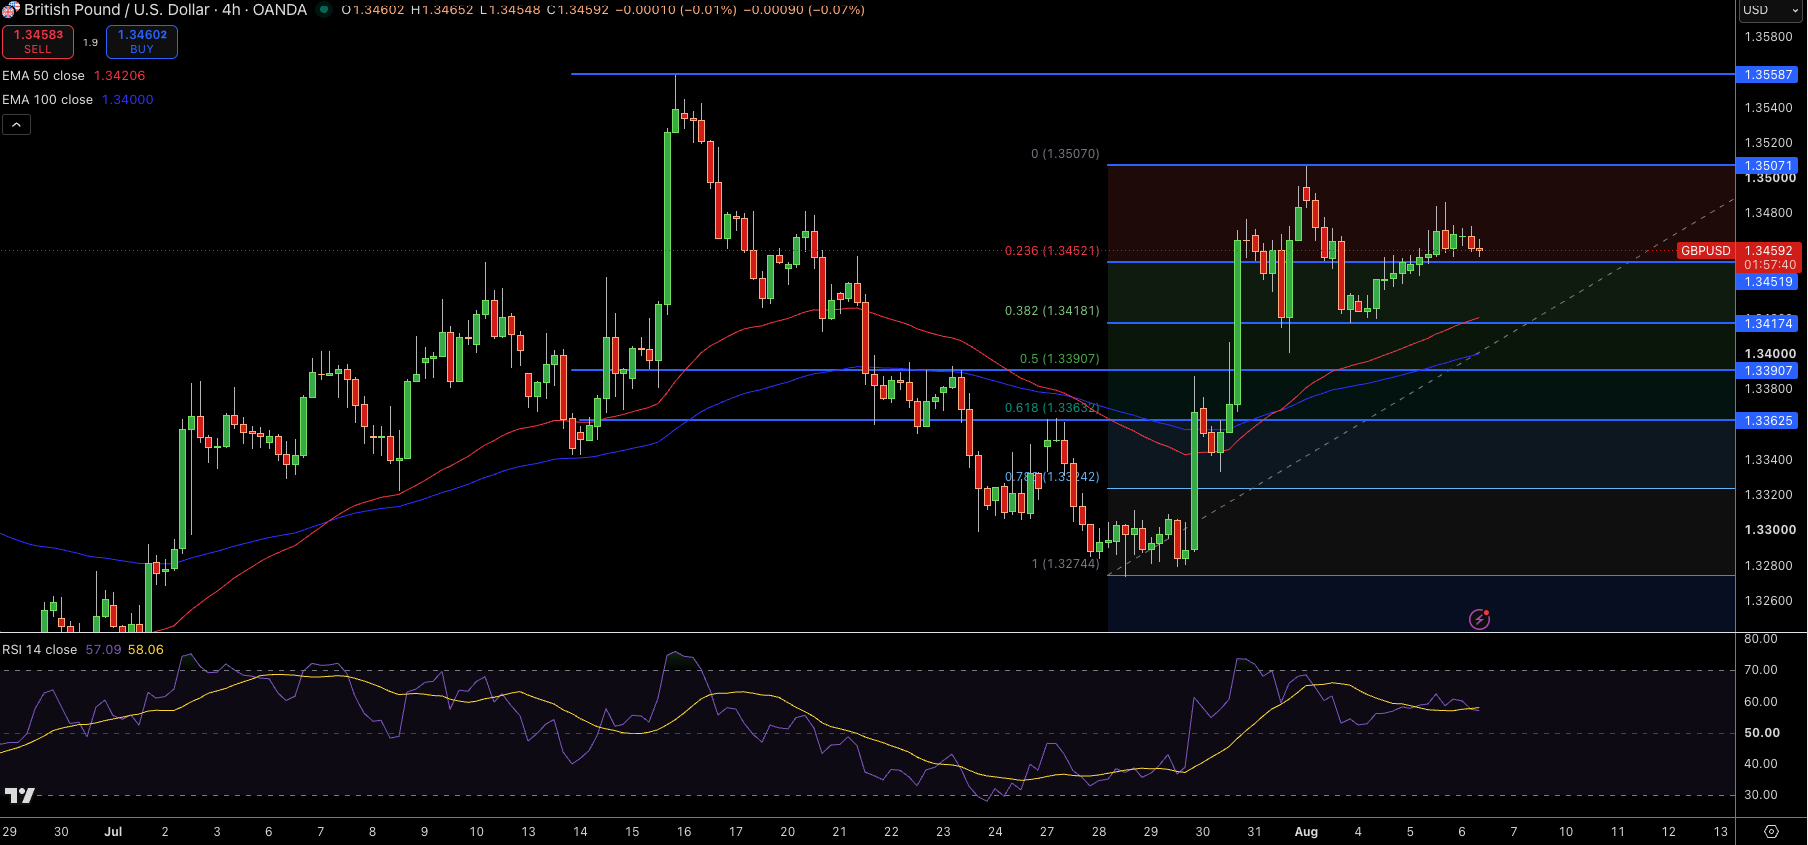
The GBP/USD is trading around $1.3459, holding within a consolidation range after rebounding sharply from $1.3274. The pair remains above both the 50-Day EMA ($1.3421) and the 100-Day EMA ($1.3400), suggesting the medium-term trend continues to favor buyers. Price is currently hovering near the 23.6% Fibonacci resistance at $1.3452, while RSI near 57 points to steady but moderating bullish momentum.
A breakout above $1.3507 would reinforce the bullish structure and expose $1.3559. On the downside, immediate support rests at $1.3417, followed by $1.3391 and $1.3363. Holding above the moving averages keeps the recovery intact, although a decisive move above $1.3507 is needed to confirm the next leg higher.
EUR/USD Price Forecast
Every new EUR/USD analysis as it publishes, today's technical signal and key levels, live price — on one page.
See all EUR/USD forecastsEUR/USD Technical Analysis: EUR/USD Bulls Challenge Major Trendline Resistance
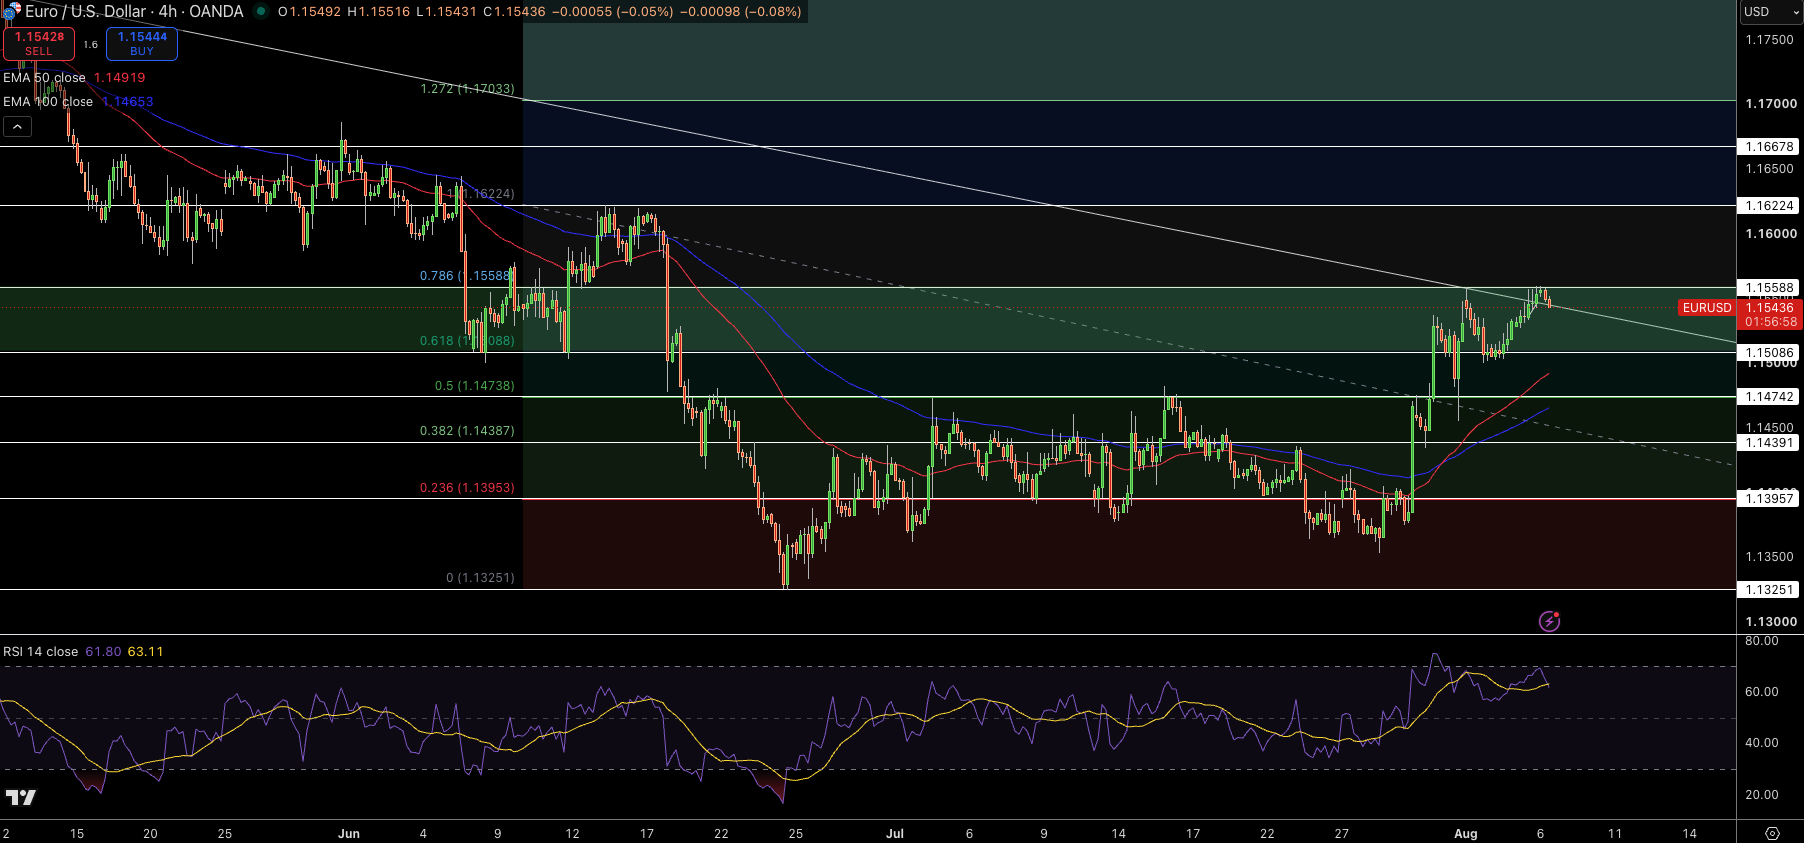
The EUR/USD pair, on the other hand, has been trying to rebound from its July base, and has been able to move past the 61.8% Fibonacci retracement level at 1.1501. For the time being, the EUR/USD pair is trying to test a key descending trendline near 1.1559, while trading comfortably above the 50-day EMA ($1.1490) and holding marginally beneath the 100-day EMA ($1.1543). RSI has strengthened to 62, confirming improving bullish momentum.
It must be noted, however, that the EUR/USD pair is still trading below the 1.1500 level. A sustained break below this level would expose the crucial support zone at the 1.1470 level. The critical descending trendline comes into the picture at the 1.1450 level. As long as the EUR/USD pair remains comfortably above the critical descending trendline, around the 1.1450 level, the bias is expected to shift to a bullish bias for the pair.