
US Dollar News: NFP Forecasts and Fed Outlook Drive FX Markets
Changes in Federal Reserve policy are the primary drivers of U.S. Dollar trading as market participants analyze upcoming U.S. Labor market data in advance of the July non-Farm Payrolls. This week’s data points include the release of the ADP private sector employment report on Wednesday, the weekly jobless claims report due out on Thursday, and the Friday release of the Payrolls report.
Current estimates suggest the U.S. economy added approximately 95,000 jobs in July, down from 121,000 in June, and the unemployment rate is likely to increase to 4.4% from 4.3%. Earlier this week the job openings data from the JOLTS report for June fell and added evidence that Labor market demand is cooling. Given the recent softer data and lower oil prices, the futures market pegged the likelihood of a Fed rate hike in September at 59% down from the 67% probability earlier this week.
The Euro is benefitting from waning concerns regarding imported inflation in the Eurozone after a dip in energy prices. Market focus is still on the ECB’s decision to leave the deposit rate at 2.25% last month, but market participants are looking to the German release of Industrial Production and Eurozone Retail Sales data for indications on the possible stabilization of the economy. ECB officials stress a meeting by meeting focus as inflation nears the 2% target with the possible re-ignition of price inflation from geopolitical concerns. Economic data of a Eurozone negative growth signal would also support the case for a rate pause.
Sterling is drawing support from falling energy prices after a recent positive engagement between the United States, Iran, and Qatar, which has eased concern about protracted supply disruptions across the Middle East. With the Bank of England having decided on leaving the Bank Rate at 3.75% last week, the focus has now turned to the upcoming UK labour market and growth data.
Investors are watching the UK data to see if inflation is trending down without a substantial negative effect on activity, while the general sentiment in the markets is being influenced by the US Payroll data due on Friday and the changing outlook on US Federal Reserve policy.

US Dollar Index (DXY) Technical Analysis: Bears Eye Trendline Breakdown Below 99.95
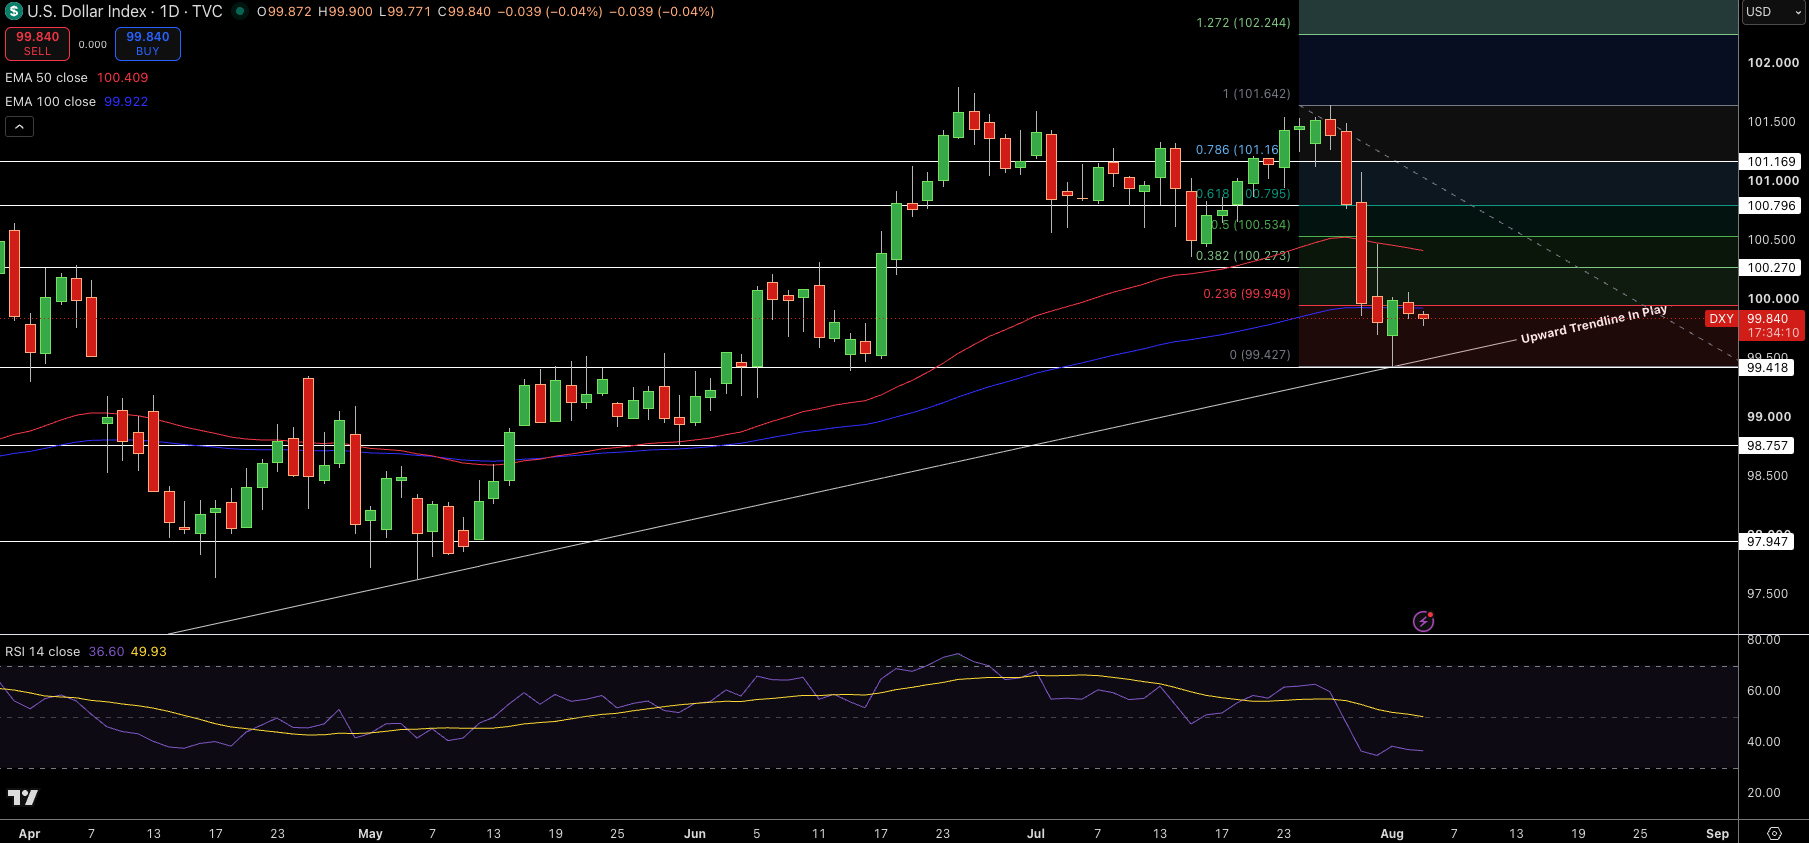
The U.S. Dollar Index (DXY) is trading at 99.84, below the 50-day EMA at 100.41, and supports the long-term ascending trendline at 99.42. The Index has recently attempted to recover the 100.27-100.53 Fibonacci resistance zone. This suggests that price action remains in a downtrend.
The 100-day EMA is located at 99.92, and has offered support. A daily close below the 99.42 long-term trendline support suggests stronger price action to the downside, with 98.76 and 97.95 as potential price targets. Bullish price action would require price action to close above 100.27. Further price targets would then be 100.80 and 101.17.
The RSI is presently at 37 and suggests that price action on the DXY is in a downtrend. Until the Index closes above 100.27, the RSI suggests that price action will continue to favor the downside.
EUR/USD Price Forecast
Every new EUR/USD analysis as it publishes, today's technical signal and key levels, live price — on one page.
See all EUR/USD forecastsGBP/USD Technical Analysis: Bulls Retain Control Above Key Fibonacci Support
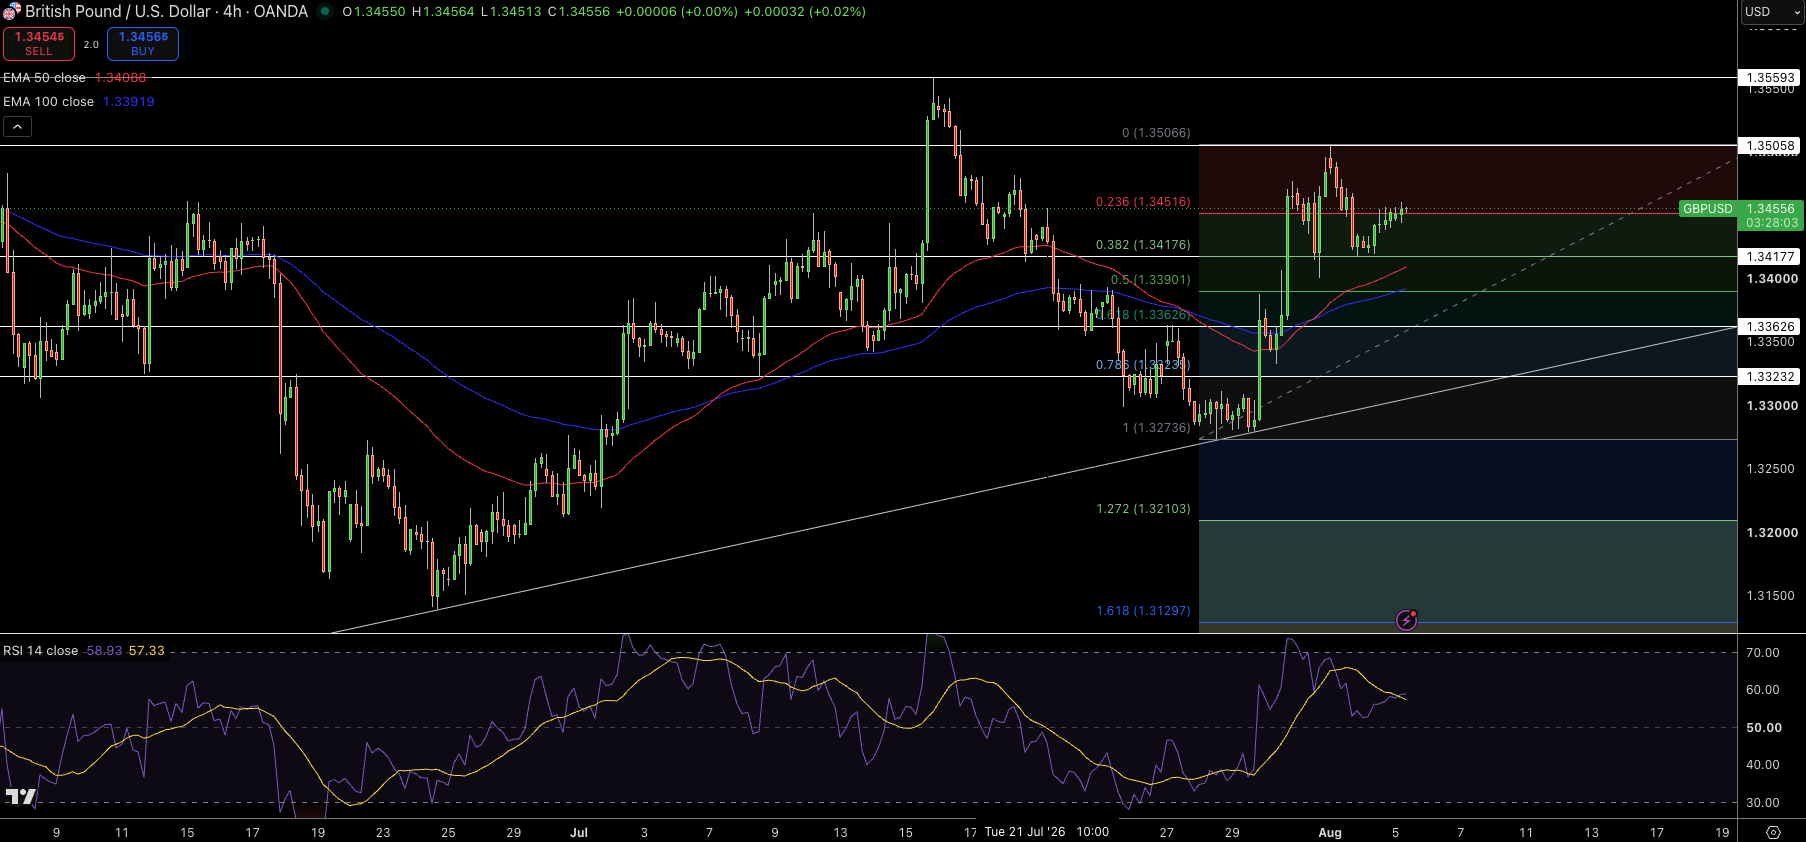
After a strong bounce from the 1.3274 swing low, GBP/USD is consolidating near 1.3456. The bullish structure is further strengthened by the GBP/USD pair trading above the 50-EMA and 100-EMA, which are presently at 1.3409 and 1.3392, respectively.
Currently, price action is maintaining a bullish structure as it is above the 23.6% Fibonacci level at 1.3452. Price action above there opens the possibility of a move higher toward 1.3506, with a break above opening up 1.3559. Price action below there opens the possibility of a move toward 1.3418, then 1.3390, and finally 1.3363. Losing any of these levels would be a negative development for the current bullish structure.
RSI is near 58, indicating positive momentum without overbought conditions. While the pair may consolidate after its recent rally, holding above 1.3418 keeps the broader bias tilted to the upside.
EUR/USD Technical Analysis: Bullish Recovery Faces Major Trendline Resistance
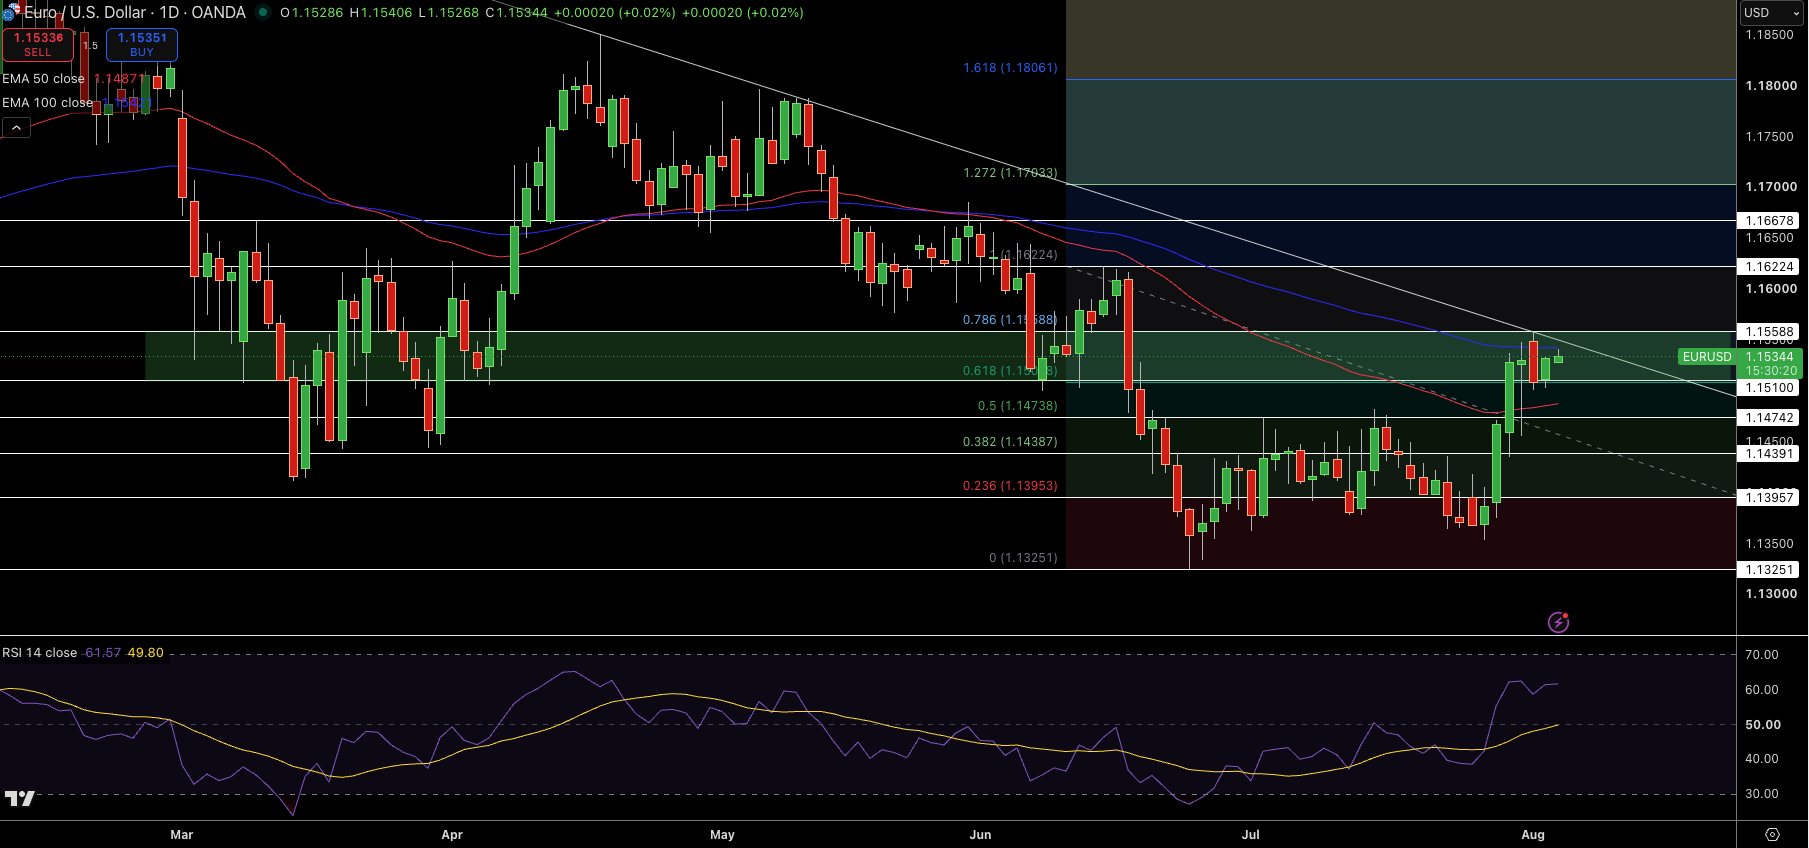
EUR/USD is currently trading around 1.1534, from where a significant bullish momentum pushed price to the 50 day MA, and now it is trading in a portion of the resistance zone at 1.1510-1.1559. Currently, price is also testing the lower boundary of the descending trendline from early 2026.
1.1559 will be the next level of resistance, and after that 1.1622 and 1.1668 will be next. Bulls will eventually need to overcome the trendline to confirm a bullish reversal, which would then create a path to the 1.1703 level. The lower boundary of the resistance zone is at 1.1510, followed by 1.1474 and then the strong level of support at 1.1439.
The bullish momentum has been confirmed by the RSI, which has recently broken above 60. As long as the price is trading above.