NASDAQ 100 Technical Analysis
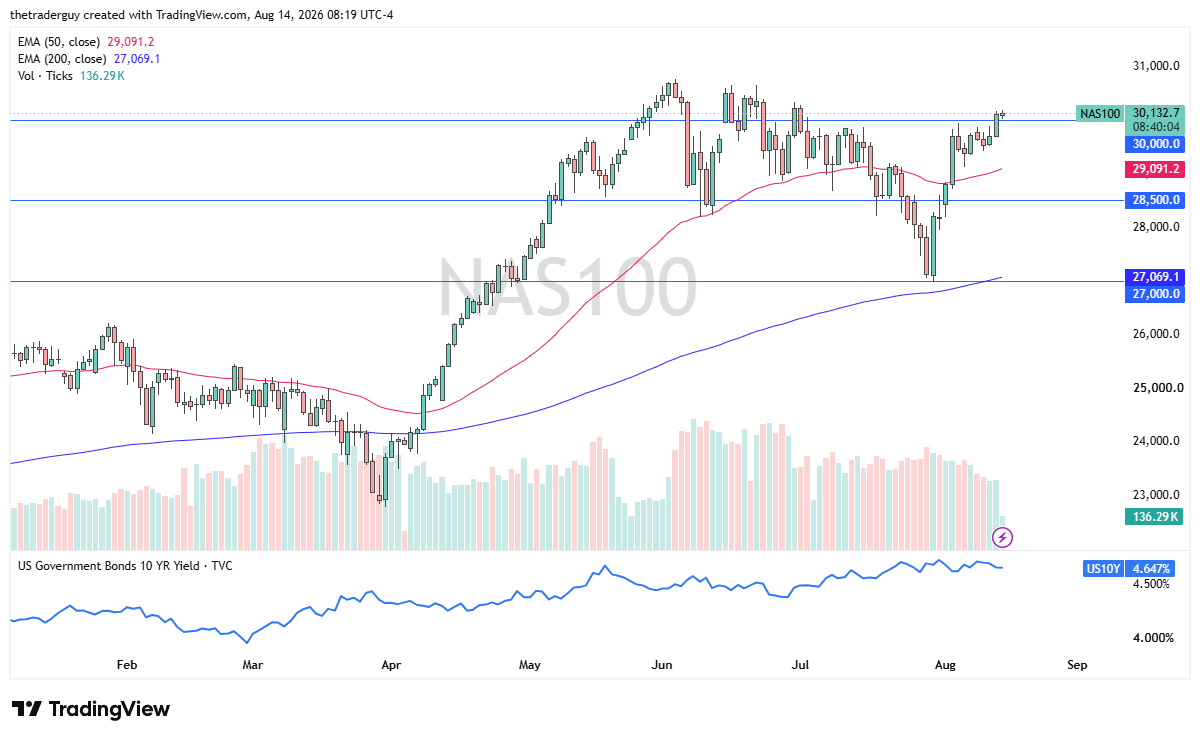
The NASDAQ 100 is slightly positive during premarket trading on Friday as we are above the 30,000 level, an area that I anticipated as being resistance earlier this week. Now that we’ve broken above there, it’s a good, healthy sign.
There’s a lot of noise between here and 30,600, so it’s not like it’s a clear shot, but it does look a lot like a bullish pennant just broke to the upside over the last 24 hours. Tech stocks, of course, are still going through some earnings and the questions about the AI world, but at the moment, it looks like the buyers might be in control.

Dow Jones 30 Technical Analysis
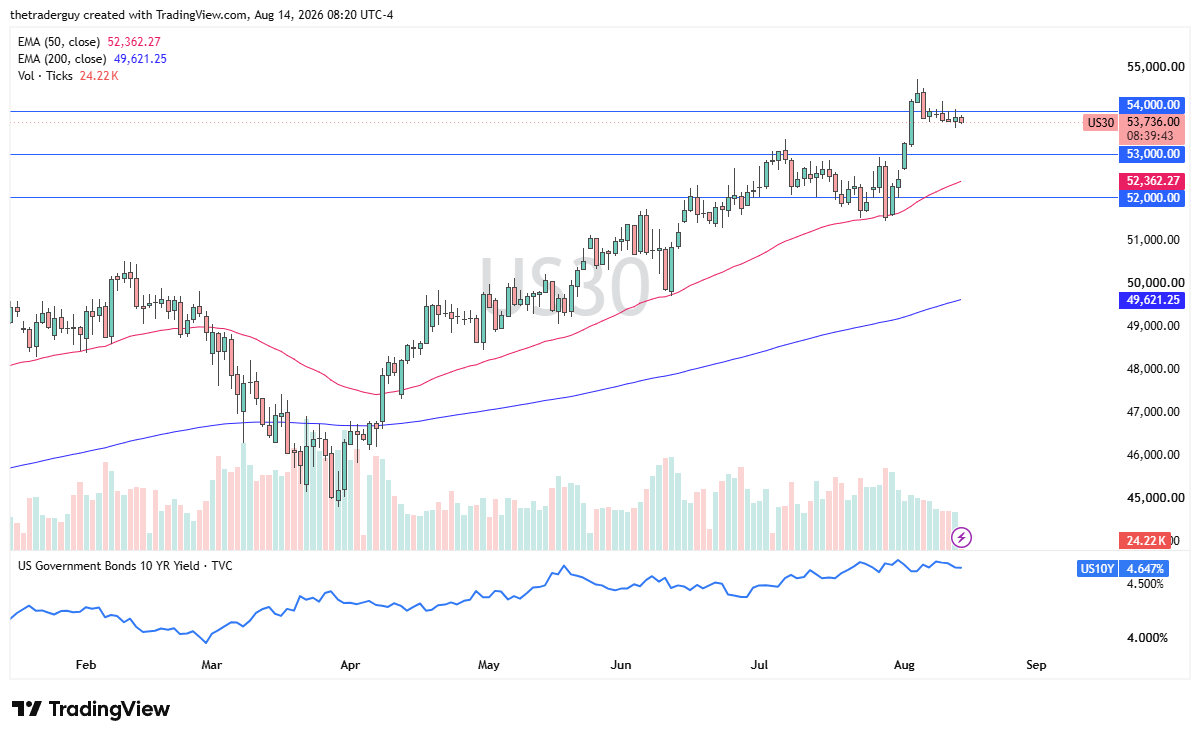
The Dow Jones 30 is slightly negative in premarket trading, but within a very tight range. It’s not as if it’s falling apart. Ultimately, it looks like it’s still in the middle of consolidation after that big shot higher a couple of weeks ago.
The 54,000 level continues to offer resistance, but has been broken previously, so one would have to question exactly how resistant this will be. Still very much in an uptrend, just looks like it’s working off some of that excess momentum.
S&P 500 Technical Analysis
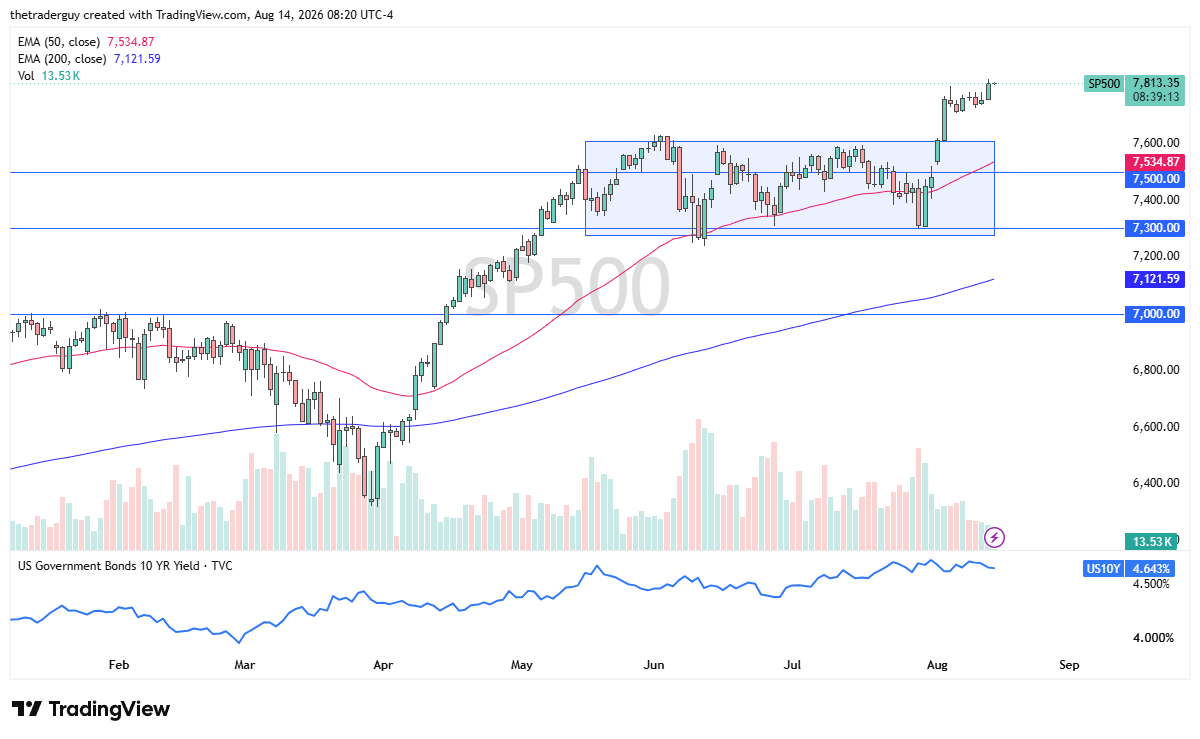
The S&P 500 is basically flat at the open after closing at an all-time high during the previous session here on Thursday going into Friday. So, the Friday session will be interesting to watch, and will it be an extension of the bullish pressure that we had seen previously?
Ultimately, this is a market that has been flagging, much like the NASDAQ 100, and much like the NASDAQ 100, it has broken out of that flag, a very bullish technical pattern. This could be a good sign given enough time.
S&P 500 Price Forecast
Every new S&P 500 analysis as it publishes, today's technical signal and key levels, live price — on one page.
See all S&P 500 forecastsIf you’d like to know more about chart patterns and how to trade them, please visit our educational area.