Pullback Tests Key Support
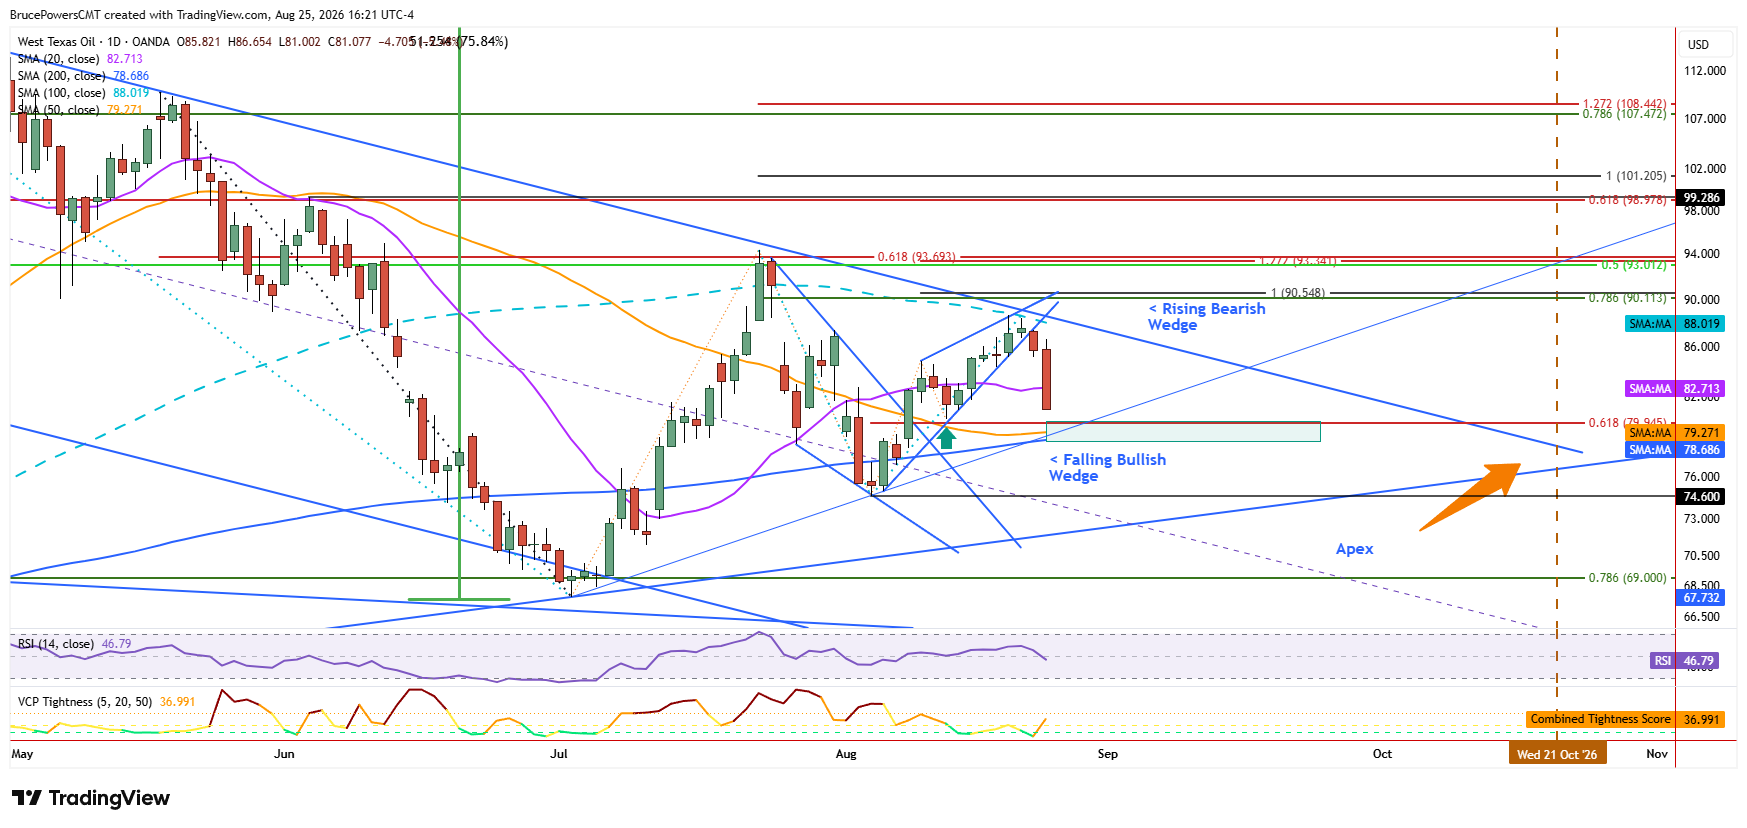
After breaking down from a rising bearish wedge on Monday, WTI crude oil extended its decline on Tuesday to test support near the 20-day moving average. So far, initial support has been seen with a six-day low of $82.29 reached. However, the bearish momentum following the wedge trigger suggests lower support levels are likely to be tested before the downswing is complete. At the time of writing, sellers remain in control with trading continuing in the lower third of the day’s range. The key question now is whether the current pullback can establish the next higher swing low within the broader consolidation pattern.

Lower Target Comes Into Focus
The 200-day moving average near $78.78 is a key lower target, as it was recently reclaimed after a short period where crude traded below it. That was during the prior pullback that led to a higher swing low of $74.60. The rising wedge pattern identifies that level as a potential target because it marks the beginning of the pattern. Given the current structure of the trend, that swing low should be retained, with the current decline ultimately resulting in another higher swing low.
A support zone surrounding the 200-day moving average is an ideal target zone for that to occur. Moreover, two relatively nearby indicators reinforce the potential for support. The 61.8% Fibonacci retracement at $79.95 and the 50-day moving average at $79.31 add to the potential for a reversal to begin at or above the 200-day moving average. In addition, a rising trendline cuts through this price area, further adding to the possibility of support holding.
Bounces May Face Resistance
Consequently, any bounce before crude reaches the $79.95 to $78.70 support zone is not likely to go far before finding sustained resistance. An initial bounce to test resistance is typical behavior following the breakdown from a consolidation pattern. Similar price behavior was seen in the opposite direction following the breakout from the falling bullish wedge pattern two weeks ago. The first pullback successfully tested support at prior resistance, resulting in a higher swing low on August 13 and a continuation of the bullish move.
Triangle Breakout Ahead
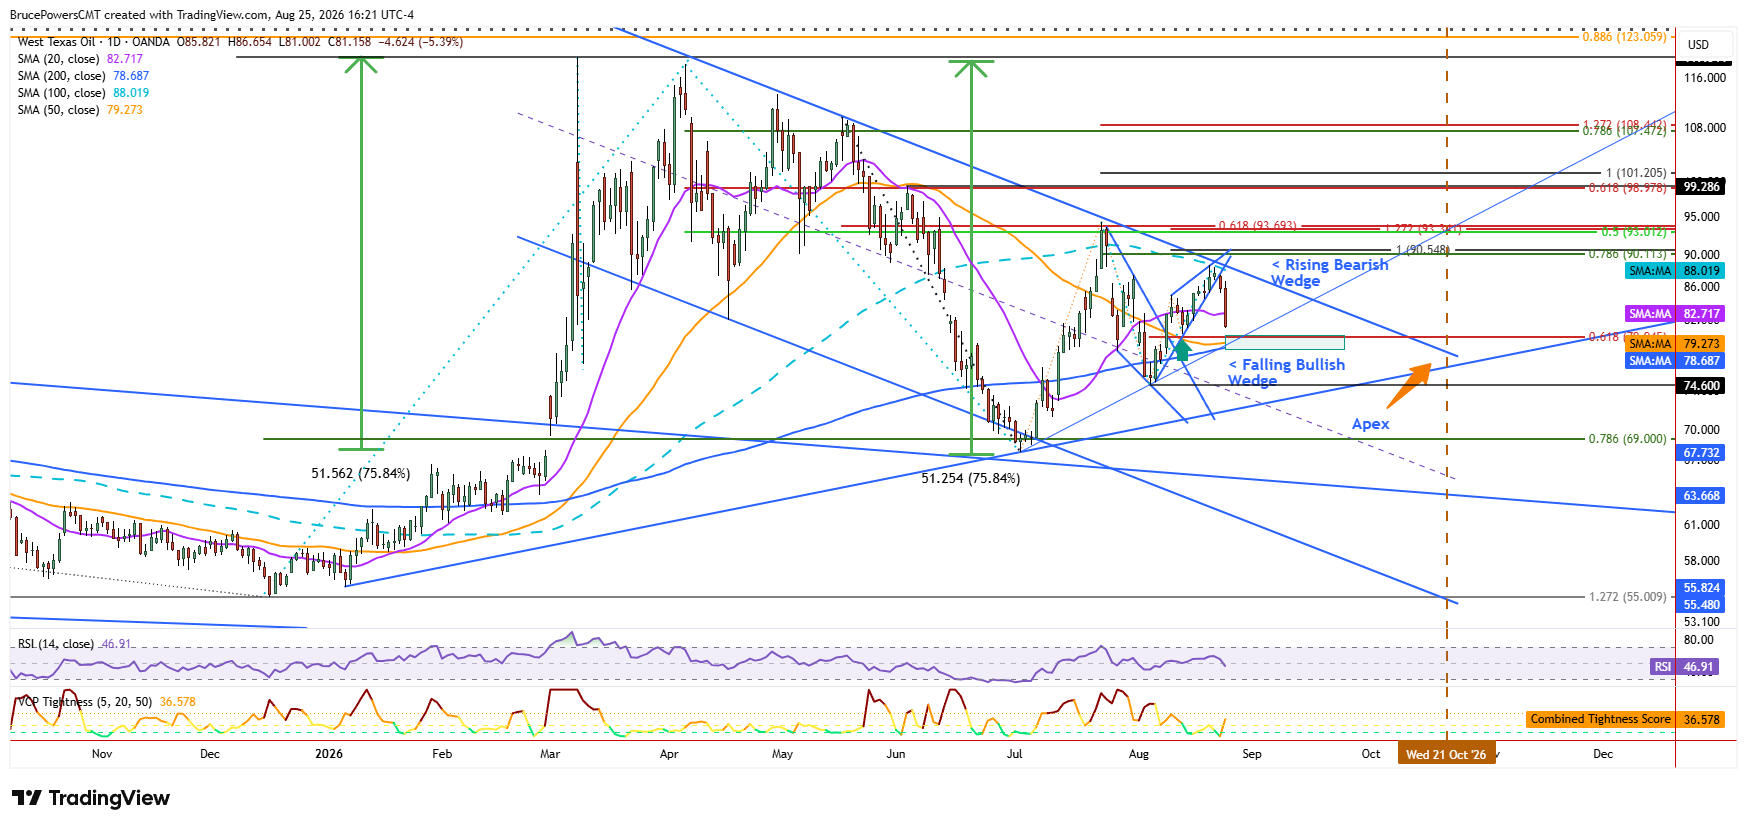
The larger pattern unfolding is a symmetrical triangle, with the current decline potentially contributing to the formation of its next higher swing low. The narrowing trading range reflects declining volatility and developing momentum ahead of an eventual breakout through either the upper or lower boundary of the triangle. The apex of the triangle is around October 21.
WTI Crude Oil Price Forecast
Every new WTI Crude Oil analysis as it publishes, today's technical signal and key levels, live price — on one page.
See all WTI Crude Oil forecastsTherefore, a breakout could reasonably occur well before the apex, potentially before mid-September. Since a sharp advance followed the prior significant pattern breakout in early March, a decisive breakout from the current consolidation could likewise trigger a strong directional move, making the development of the next swing low particularly important to the broader structure now unfolding.
If you’d like to know more about how to trade crude oil, please visit our educational area.