BTC Tests $60,000 Support: US Inflation Not Cool Enough
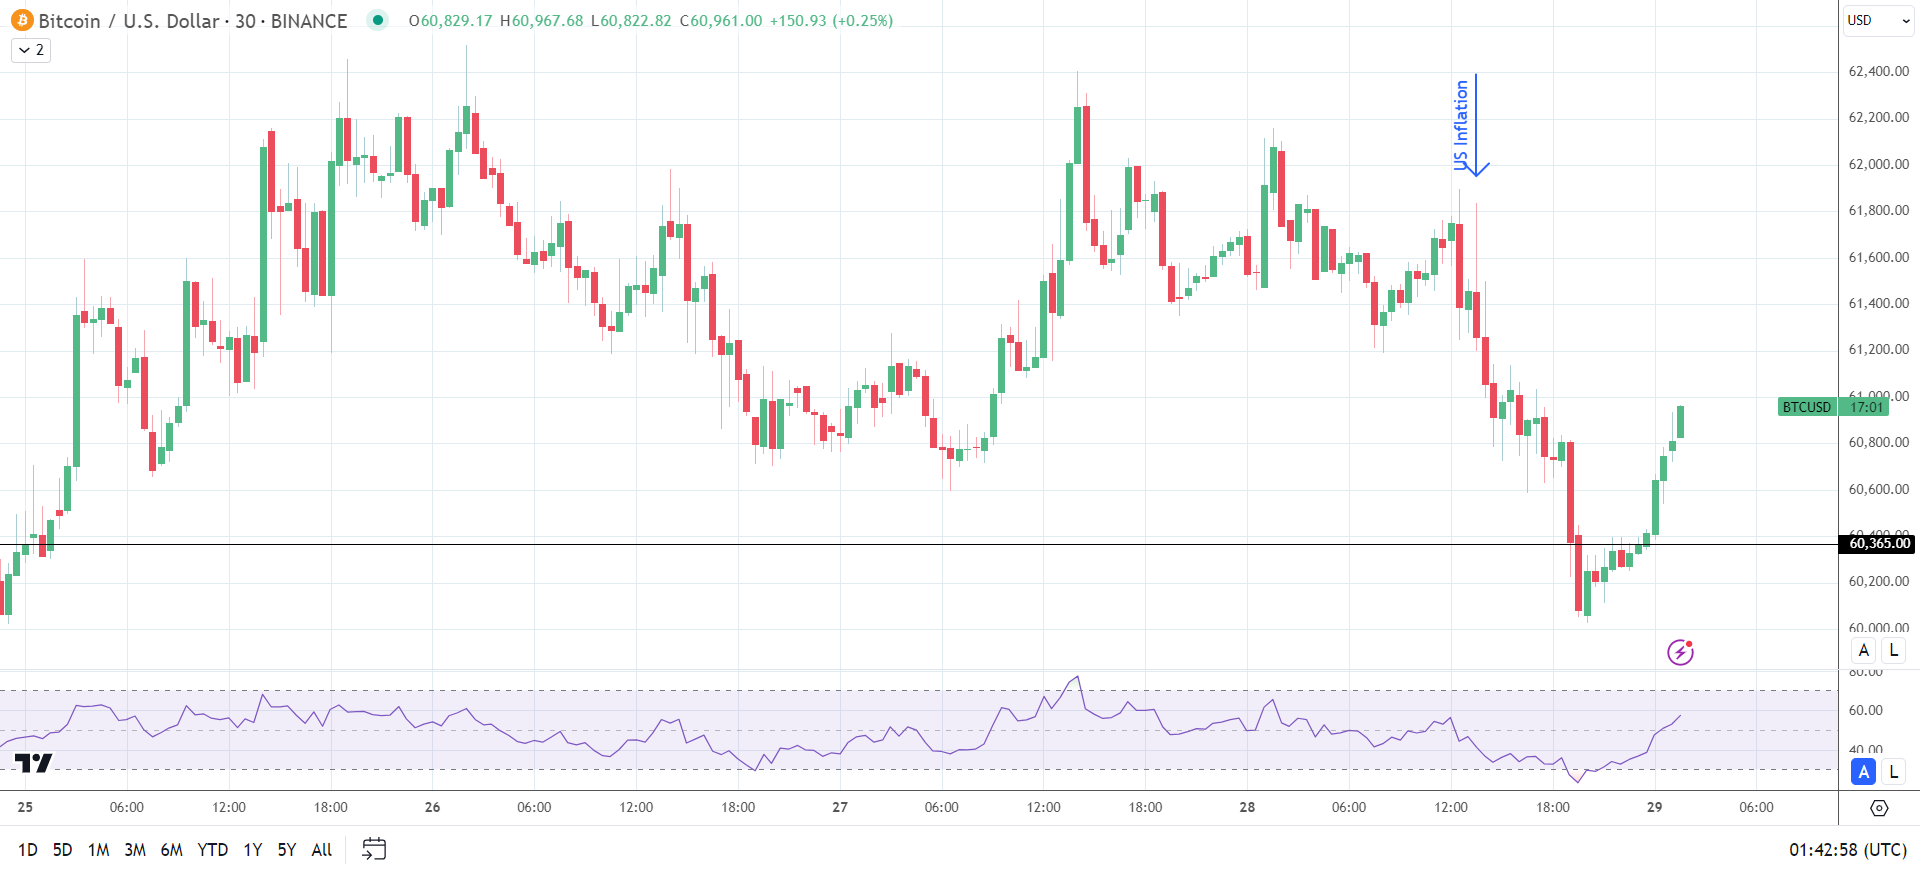
On Friday, June 28, bitcoin (BTC) declined by 2.07%. Reversing a 1.38% gain from Thursday, June 27, BTC ended the session at $60,413.
BTC remained in the hands of the US Federal Reserve, with easing bets on a September Fed rate cut impacting buyer demand for BTC.
According to the CME FedWatch Tool, the chances of a September Fed rate cut fell from 65.9% to 64.1% on Friday. While the decline was modest, investors had hoped for US economic indicators to cement a September Fed rate cut.
The US Core PCE Price Index increased 2.6% year-on-year in May after a rise of 2.8% in April.
Furthermore, personal income and spending were on an upward trend, suggesting more stickiness in the inflation environment.
Investors reacted to the numbers, with BTC sliding to a Friday low of $60,027.
Did the US inflation numbers impact buyer demand for US BTC-spot ETFs?

Outflows in the US BTC-Spot ETF Market
On Friday, June 28, the US BTC-spot ETF market likely saw total net outflows, ending a three-day inflow streak. The US BTC-spot ETF market saw total net inflows of $11.8 million on Thursday, June 27.
According to Farside Investors,
- Grayscale Bitcoin Trust (GBTC) saw net outflows of $27.2 million on Friday after net outflows of $11.4 million on Thursday.
- Fidelity Wise Origin Bitcoin Fund (FBTC) had net outflows of $25.0 million. (Thurs: Inflows of $6.7 million).
- ARK 21Shares Bitcoin ETF (ARKB) reported total net inflows of $42.8 million, the highest since June 5.
- Excluding flow data for iShares Bitcoin Trust (IBIT), the US BTC-spot ETF market reported total net outflows of $9.4 million on Friday, June 28.
With the US BTC-spot ETF market and BTC struggling, Bitcoin Fear and Greed Index trends reflected recent shifts in investor sentiment.
Bitcoin Price Forecast
Every new Bitcoin analysis as it publishes, today's technical signal and key levels, live price — on one page.
See all Bitcoin forecastsAnalysis of Investor Sentiment via BTC Fear & Greed Index
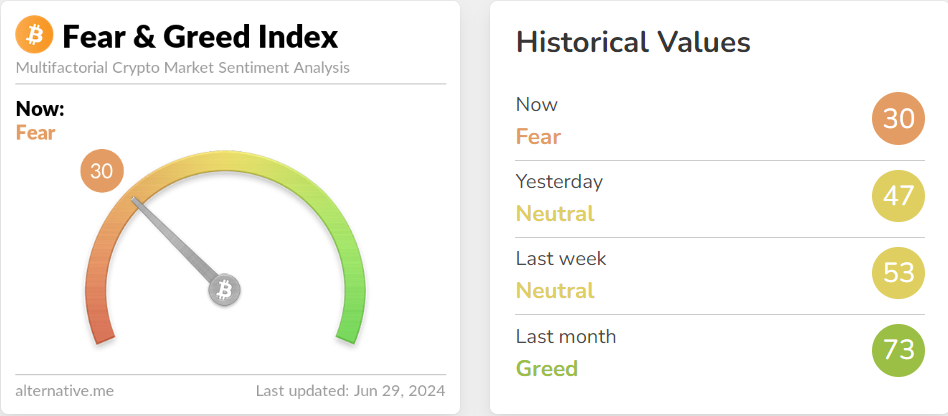
On Saturday, June 29, the Bitcoin Fear & Greed Index sat in the Fear zone, with a value of 30. Notably, the Fear & Greed Index struck a May high of 73 before the shift in sentiment.
A further decline into the Extreme Fear zone could be a buy signal. Historically, periods of Extreme Fear have often preceded significant price recoveries. The Extreme Fear zone suggests investors are too pessimistic. The Index last visited the Extreme Fear zone in September 2022. From January 2023, BTC rallied to a new all-time high of $73,808 before hitting the reverse.
Nevertheless, investors should not use the Index in isolation.
Will dip buyers see BTC at current levels as a buying opportunity?
Technical Analysis
Bitcoin Analysis
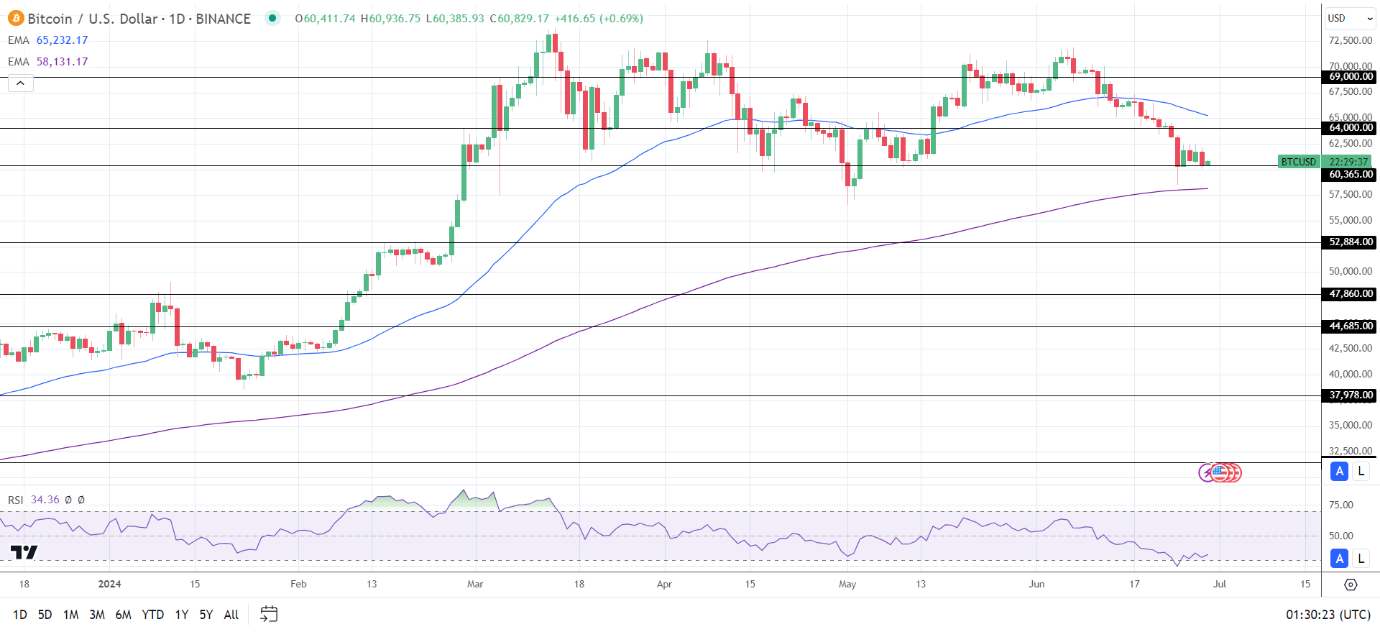
BTC remained below the 50-day EMA but held above the 200-day EMA. The EMAs confirmed the bearish near-term signals but bullish longer-term trends.
A BTC return to $62,500 could signal a break above the $64,000 resistance level. A breakout from the $64,000 resistance would support a move to the 50-day EMA.
SEC activity, sentiment toward the Fed rate path, and US BTC-spot ETF flow trends need consideration.
On the other hand, a break below the $60,365 support level could give the bears a run at the 200-day EMA.
With a 34.46 14-Daily RSI reading, BTC may drop to the 200-day EMA before entering oversold territory.
Ethereum Analysis
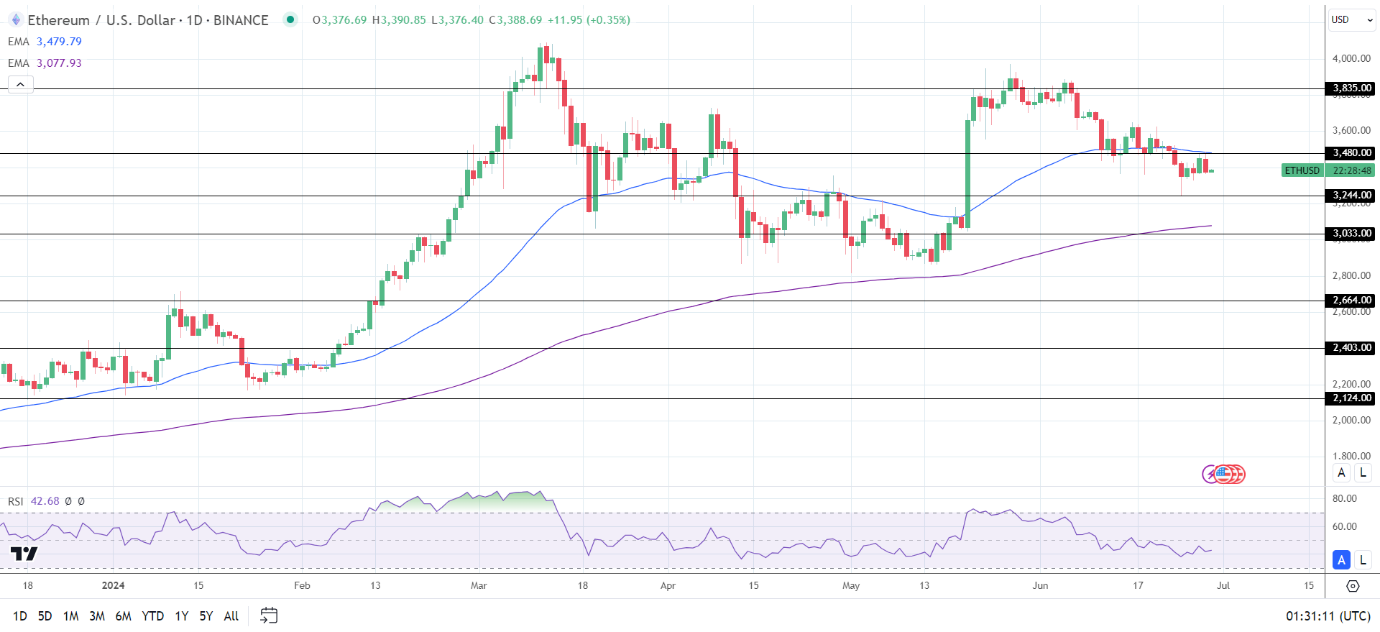
ETH hovered below the 50-day EMA while sitting above the 200-day EMA. The EMAs affirmed the bearish near-term but bullish longer-term price signals.
A break above the $3,480 resistance level and the 50-day EMA could signal a return to the $3,600 handle. Selling pressure may increase at the $3,480 resistance level. The 50-day EMA is confluent with the resistance level.
US ETH-spot ETF-related chatter needs consideration.
Conversely, an ETH drop below the $3,244 support level could bring the 200-day EMA and the $3,033 support level into play.
The 14-period Daily RSI reading, 42.68, suggests an ETH drop below the $3,244 support level before entering oversold territory.