BTC Reacts to US Economic Data and Fed Rate Cut Bets
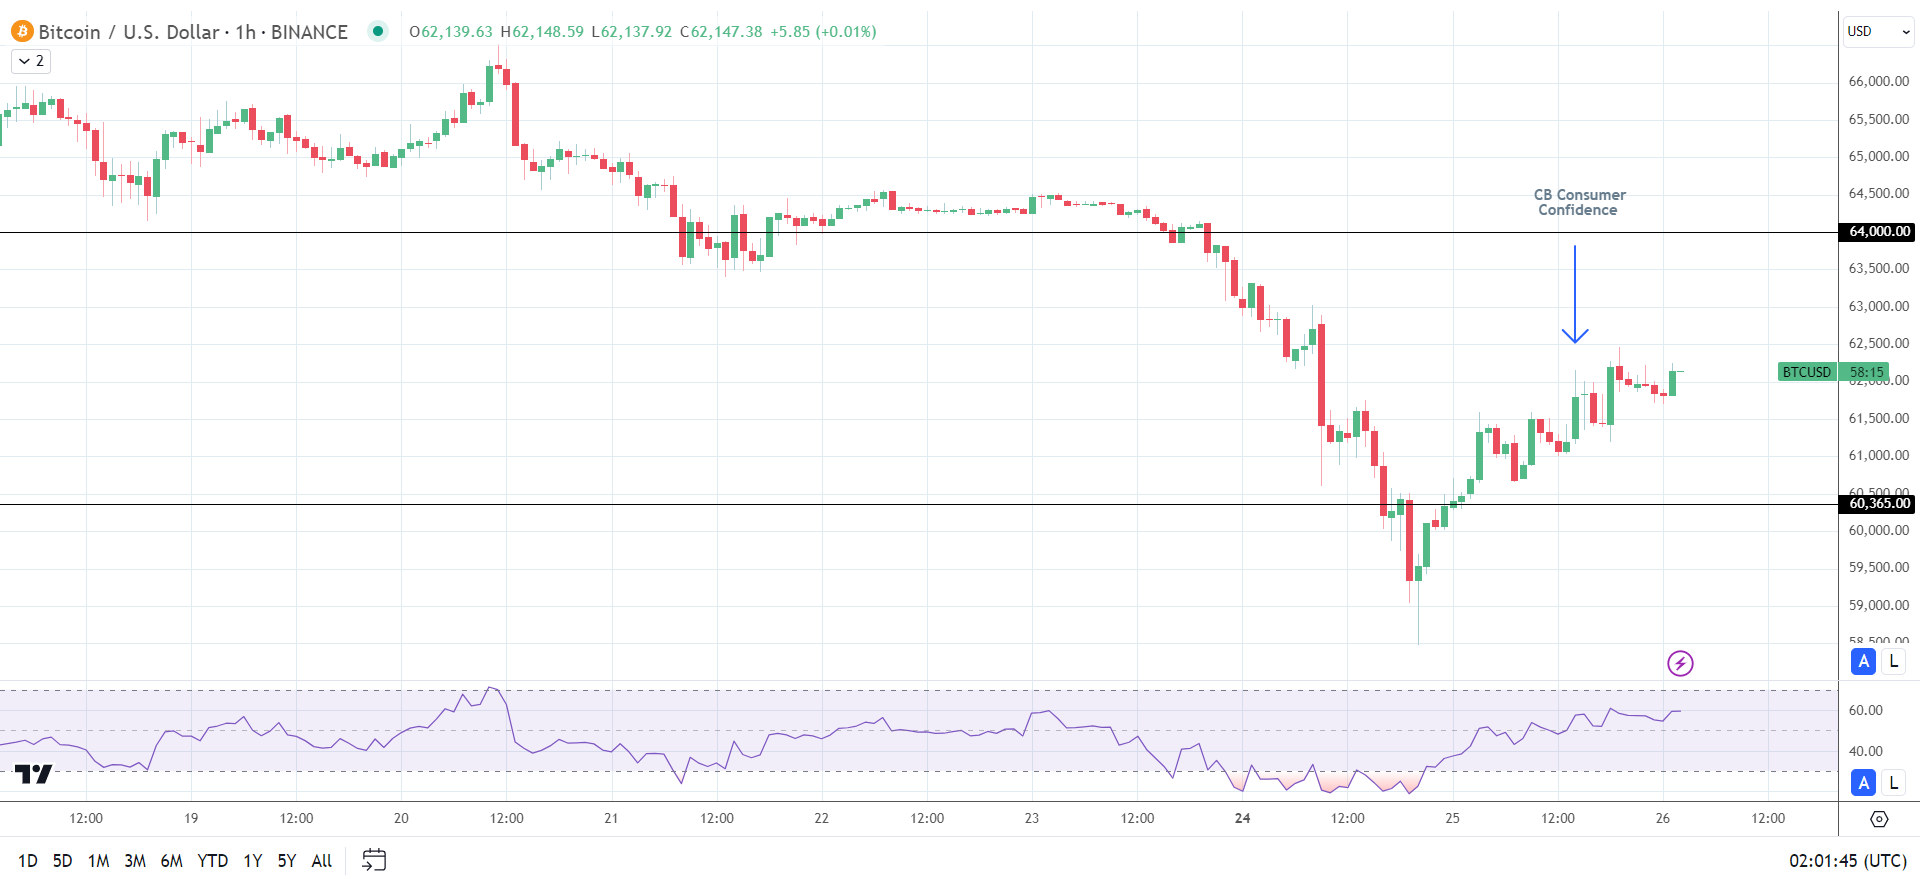
On Tuesday, June 25, bitcoin (BTC) advanced by 2.52%. Partially reversing a 4.48% tumble from Monday, BTC ended the session at $61,848.
Investors reacted to the US economic calendar, with US consumer confidence numbers supporting a September Fed rate cut.
The CB Consumer Confidence Index fell from 101.3 to 100.4 in June. Weaker consumer confidence could signal a pullback in consumer spending and damper demand-driven inflationary pressures. Significantly, BTC rose to a session high of $62,459 in response to the data before returning below the $62,000 handle.
Despite the softer consumer confidence numbers, investors may need to wait until Friday for a clearer view of the Fed’s rate path. According to the FedWatch Tool, the chances of the Fed holding interest rates unchanged in September increased from 31.5% to 33.3% on Tuesday. One week earlier, the probability of the Fed standing pat stood at 33.0%
Could investor expectations of a September Fed rate cut drive buyer demand for US BTC-spot ETFs?
US inflation numbers on Friday could prove pivotal to near-term BTC price trends.

US Spot-ETF Market Ends Seven-Day Outflow Streak
The US economic indicators provided the US BTC-spot ETF market relief. US BTC-spot ETF market inflows contributed to BTC gains in the Wednesday morning session.
According to Farside Investors:
- Grayscale Bitcoin Trust (GBTC) saw net outflows of $30.3 million on Tuesday, down from $90.4 million on Monday.
- Fidelity Wise Origin Bitcoin Fund (FBTC) reported net inflows of $48.8 million after seeing net outflows of $35.2 million on Monday.
- Bitwise Bitcoin ETF (BITB) saw net inflows of $15.2 million, reversing outflows of $8.2 million from Monday.
- Excluding flow data for iShares Bitcoin Trust (IBIT), the US BTC-spot ETF market saw total net inflows of $31.0 million on Tuesday after net outflows of 174.5 million on Monday.
Significantly, the US BTC-spot ETF market ended a seven-day outflow streak, supporting a positive start to the Wednesday session.
Bitcoin Price Forecast
Every new Bitcoin analysis as it publishes, today's technical signal and key levels, live price — on one page.
See all Bitcoin forecastsTechnical Analysis
Bitcoin Analysis
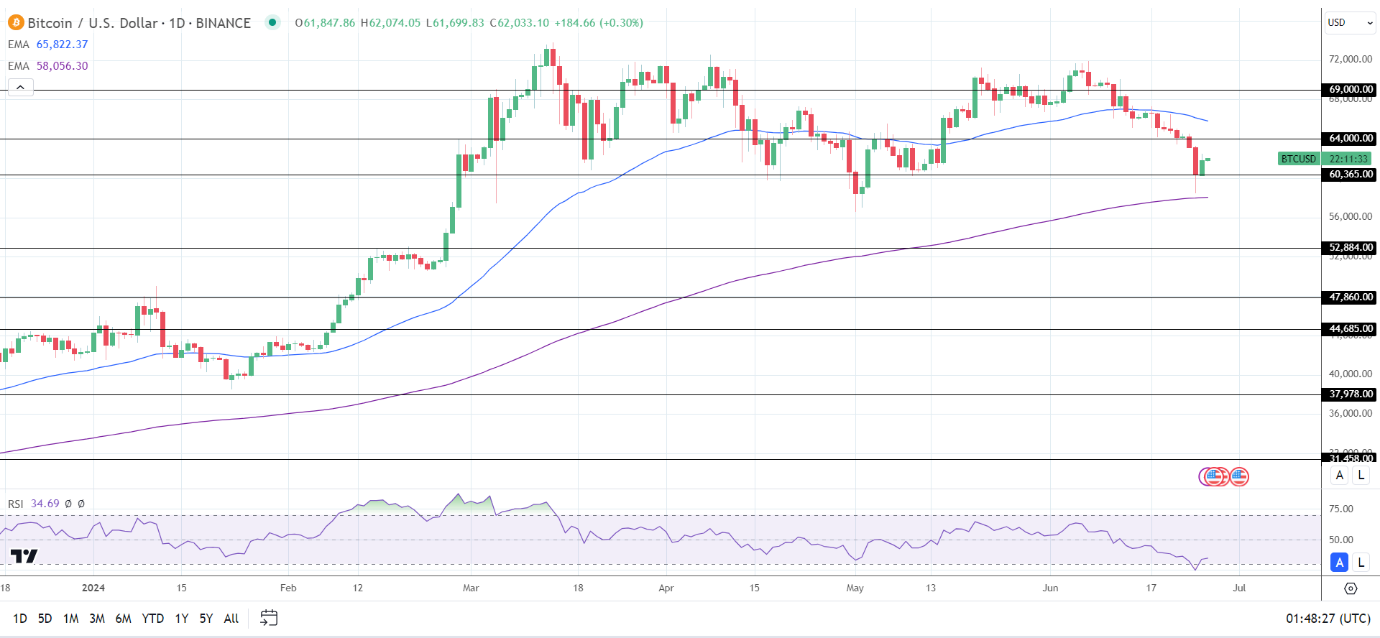
BTC remained below the 50-day EMA but held above the 200-day EMA. The EMAs affirmed the bearish near-term signals but bullish longer-term signals.
A BTC move through the $64,000 resistance level could give the bulls a run at the 50-day EMA. A break above the 50-day EMA could bring the $69,000 resistance level into play.
SEC activity, the US economic calendar, and BTC-spot ETF flow data require investor consideration on Wednesday.
On the other hand, a drop below the $60,365 support level could bring the 200-day EMA into play.
With a 34.69 14-Daily RSI reading, BTC may drop to the 200-day EMA before entering oversold territory.
Ethereum Analysis
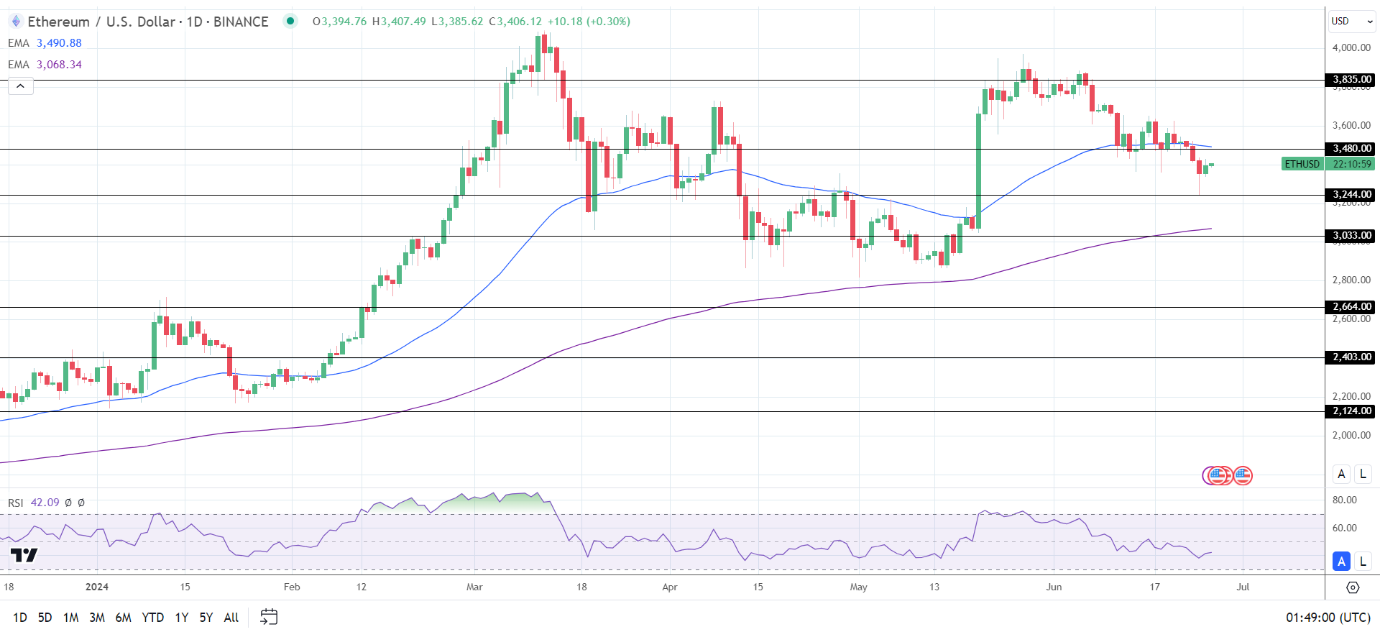
ETH hovered below the 50-day EMA while holding above the 200-day EMA. The EMAs confirmed the bearish near-term but bullish longer-term price trends.
A break above the $3,480 resistance level and the 50-day EMA would support a move to the $3,600 handle. Selling pressure could intensify at the $3,480 resistance level. The 50-day EMA is confluent with the resistance level. A break above the 50-day EMA could signal a move toward the $3,835 resistance level.
US ETH-spot ETF-related chatter needs consideration.
Conversely, an ETH break below the $3,244 support level could bring the 200-day EMA and the $3,033 support level into play.
The 14-period Daily RSI reading, 42.09, indicates an ETH break below the $3,244 support level before entering oversold territory.