
Key Insights:
- On Sunday, BTC slipped by 0.24% to end the day at $30,542.
- It was a quiet Sunday, with no crypto events to move the dial.
- However, the technical indicators remain bullish, signaling a return to $32,500.
On Sunday, bitcoin (BTC) fell by 0.24%. Following a 0.58% loss on Saturday, BTC ended the week up 15.54% to $30,542. Significantly, BTC revisited the $31,000 handle for the second time in three sessions.
A bullish start to the day saw BTC rise to an early high of $31,120. BTC broke through the First Major Resistance Level (R1) at $30,891 before falling to a late-session low of $30,326. Finding support at the First Major Support Level (S1) at $30,341, BTC revisited the $30,600 handle before falling back into the red.

ETF Chatter Delivers Another Cushion
It was a quiet weekend, with no crypto events to guide BTC and the broader crypto market.
The lack of crypto events left investors to consider the chances of the SEC approving the Blackrock (BLK) spot BTC ETF following the surprise approval of the Volatility Shares Trust 2x Bitcoin Strategy ETF.
Despite the bullish sentiment and the breakout week, regulatory uncertainty continues to plague the US crypto market. However, the outcome of the SEC v Ripple case could be a game-changer vis-à-vis the SEC and regulation by enforcement, with a Court ruling likely at any time.
The Day Ahead
It is a quiet start to the week, with no US economic indicators to draw investor attention. The lack of economic indicators will leave BTC in the hands of Fed chatter and the crypto news wires.
SEC v Ripple, Coinbase (COIN), and Binance-related news will need consideration, with US lawmakers and SEC chatter also likely to move the dial.
Ripple Price Forecast
Every new Ripple analysis as it publishes, today's technical signal and key levels, live price — on one page.
See all Ripple forecastsBitcoin (BTC) Price Action
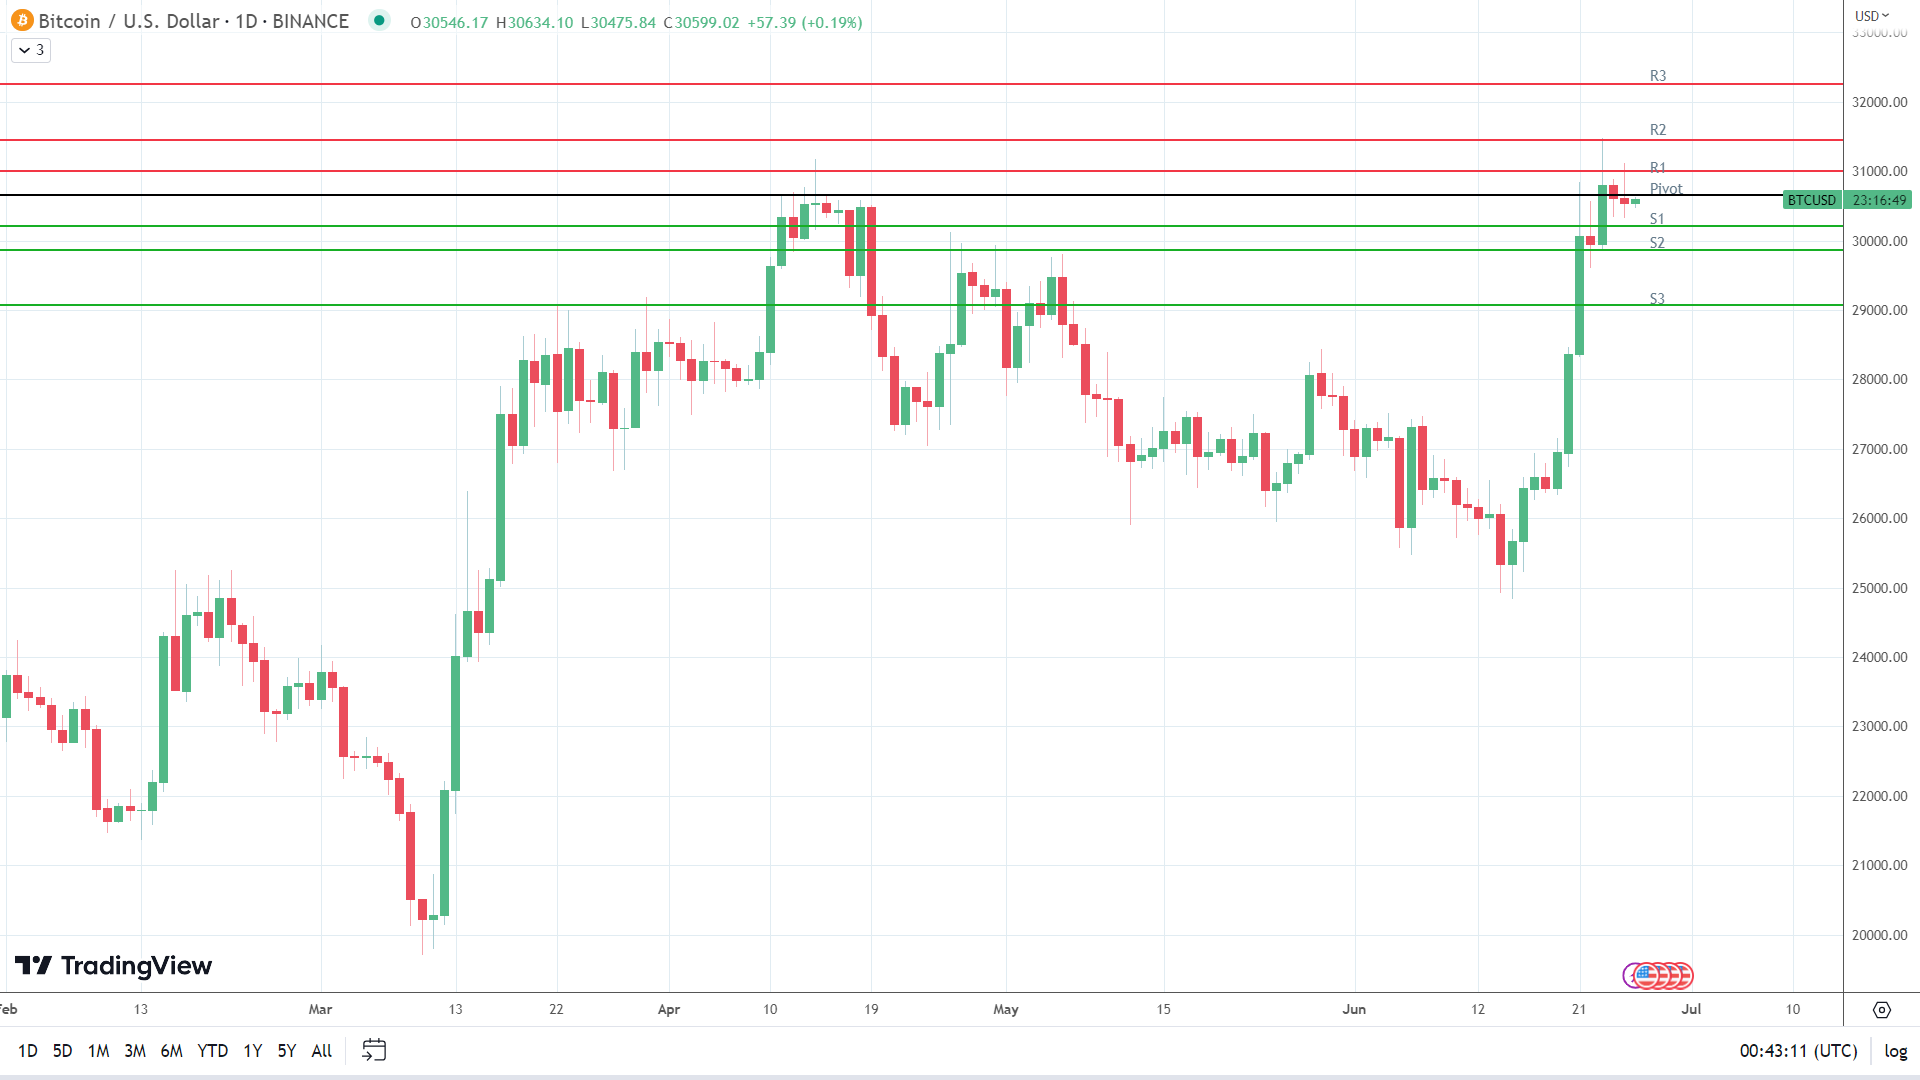
This morning, BTC was up 0.19% to $30,599. A mixed start to the day saw BTC fall to an early low of $30,486 before rising to a high of $30,634.
BTC Technical Indicators
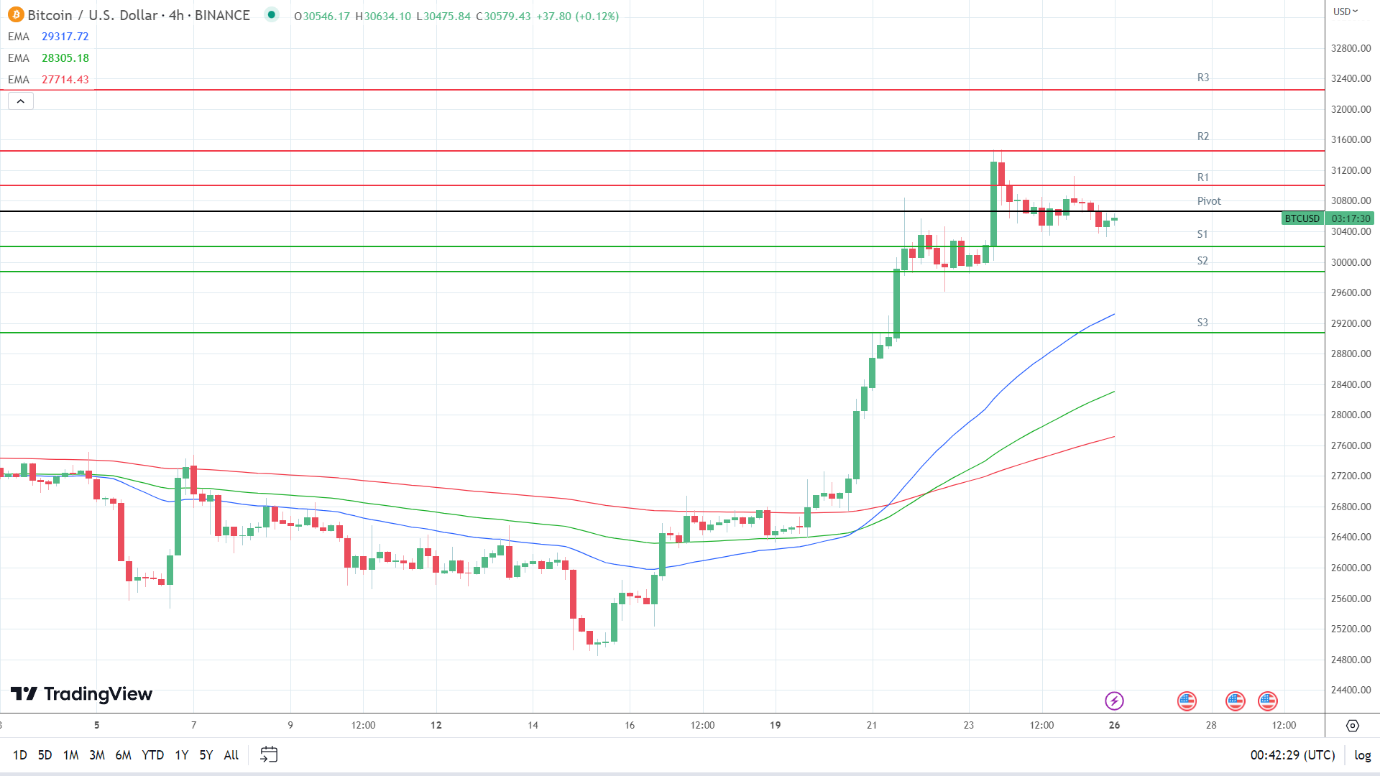
Looking at the EMAs and the 4-hourly candlestick chart (below), the EMAs sent bullish signals. BTC sat above the 50-day EMA ($29,318). The 50-day EMA pulled further away from the 100-day EMA, with the 100-day EMA widening from the 200-day EMA, sending bullish signals.
A hold above the Major Support Levels and the 50-day EMA ($29,318) would support a move through R1 ($30,999) to give the bulls a run at R2 ($31,457) and $31,500. However, a fall through S1 ($30,205) would bring S2 ($29,869) and the 50-day EMA ($29,318) into view. A fall through the 50-day EMA would signal a near-term bullish trend reversal.
Resistance & Support Levels
| R1 – $ | 30,999 | S1 – $ | 30,205 |
| R2 – $ | 31,457 | S2 – $ | 29,869 |
| R3 – $ | 32,251 | S3 – $ | 29,075 |