Key Insights:
- On Monday, bitcoin (BTC) slid by 3.15%, ending the day at sub-$16,000 for the second time since 2020.
- News of Genesis facing the risk of bankruptcy sent the broader crypto market into the red.
- The Fear & Greed Index defied gravity, rising from 21/100 to 22/100, suggesting a degree of investor resilience.
On Monday, bitcoin (BTC) slid by 3.15%. Following a 2.50% loss from Sunday, BTC ended the day at $15,765. Notably, BTC ended the day at sub-$16,000 for only the second time since 2020.
A mixed start to the day saw BTC rise to an early high of $16,305. Coming up short of the First Major Resistance Level (R1) at $16,619, BTC slid to a late low of $15,487. BTC fell through the First Major Support Level (S1) at $16,061 and the Second Major Support Level (S2) at $15,843 to end the day at sub-$15,500.
FTX contagion risk continued to pressure investor appetite on Monday. On Monday, news of Genesis delivering a bankruptcy warning sent the broader crypto market into the red.
The Genesis news followed reports of FTX creditor numbers, which reignited contagion fear over the weekend.
Considering the amount FTX owes its biggest creditors, more bankruptcy warnings are likely over the near term, which will leave investors on tenterhooks and a cap on any upside.
While BTC slid by 3.15%, the NASDAQ Composite Index fell by a modest 1.09%, weighed by news of a fresh wave of COVID-19 cases in China.

The Fear & Greed Index Avoids Sub-20 Despite BTC Return to Sub-16,000
Today, the Fear & Greed Index rose from 21/100 to 22/100. The increase came despite BTC ending the day at sub-$16,000 for only the second time since 2020.
While increased contagion risk weighed on BTC, the Index suggests investor resilience at current levels. However, downside risks remain, with reports of more crypto platform bankruptcy warnings likely to test investor sentiment further.
Avoiding sub-20/100 remains the key for the bulls. A fall to sub-20/100 would see BTC face the risk of sub-$10,000.
Bitcoin Price Forecast
Every new Bitcoin analysis as it publishes, today's technical signal and key levels, live price — on one page.
See all Bitcoin forecasts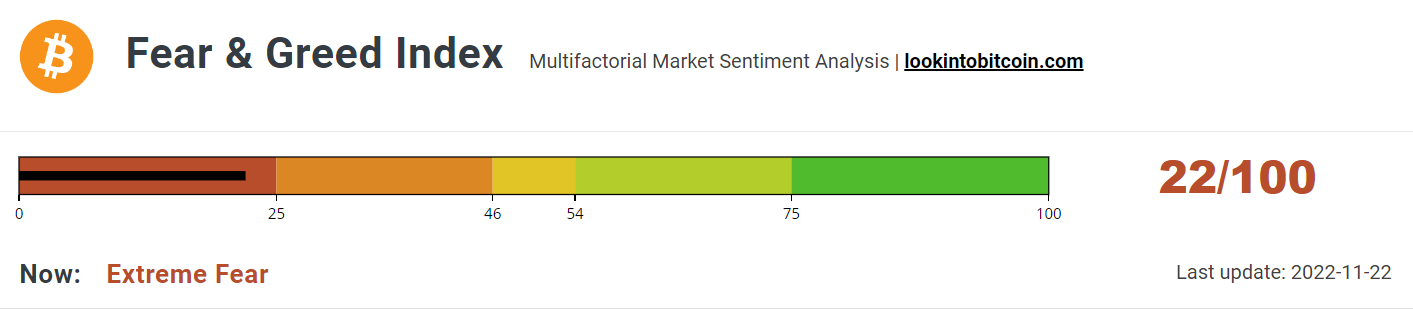
Bitcoin (BTC) Price Action
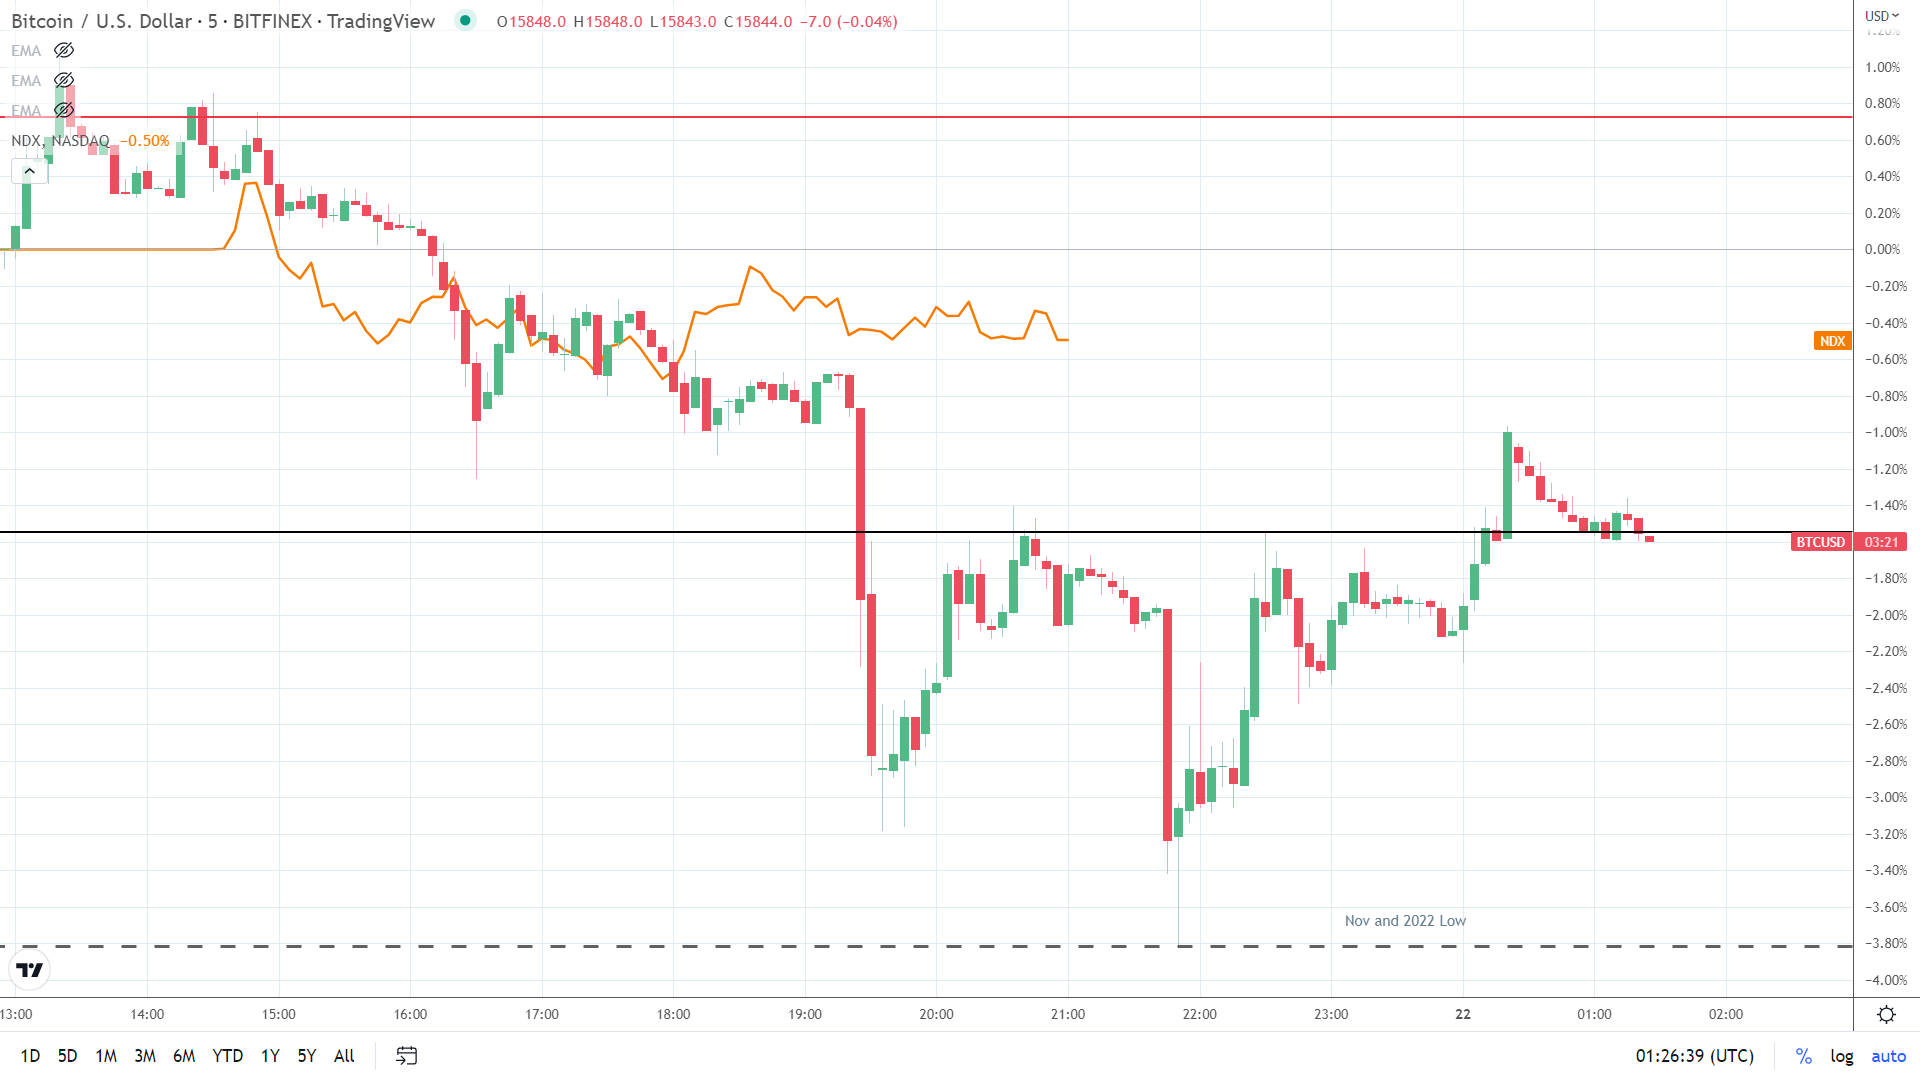
At the time of writing, BTC was up 0.51% to $15,845. A bullish start to the day saw BTC rise from an early low of $15,736 to a high of $15,945.
Technical Indicators
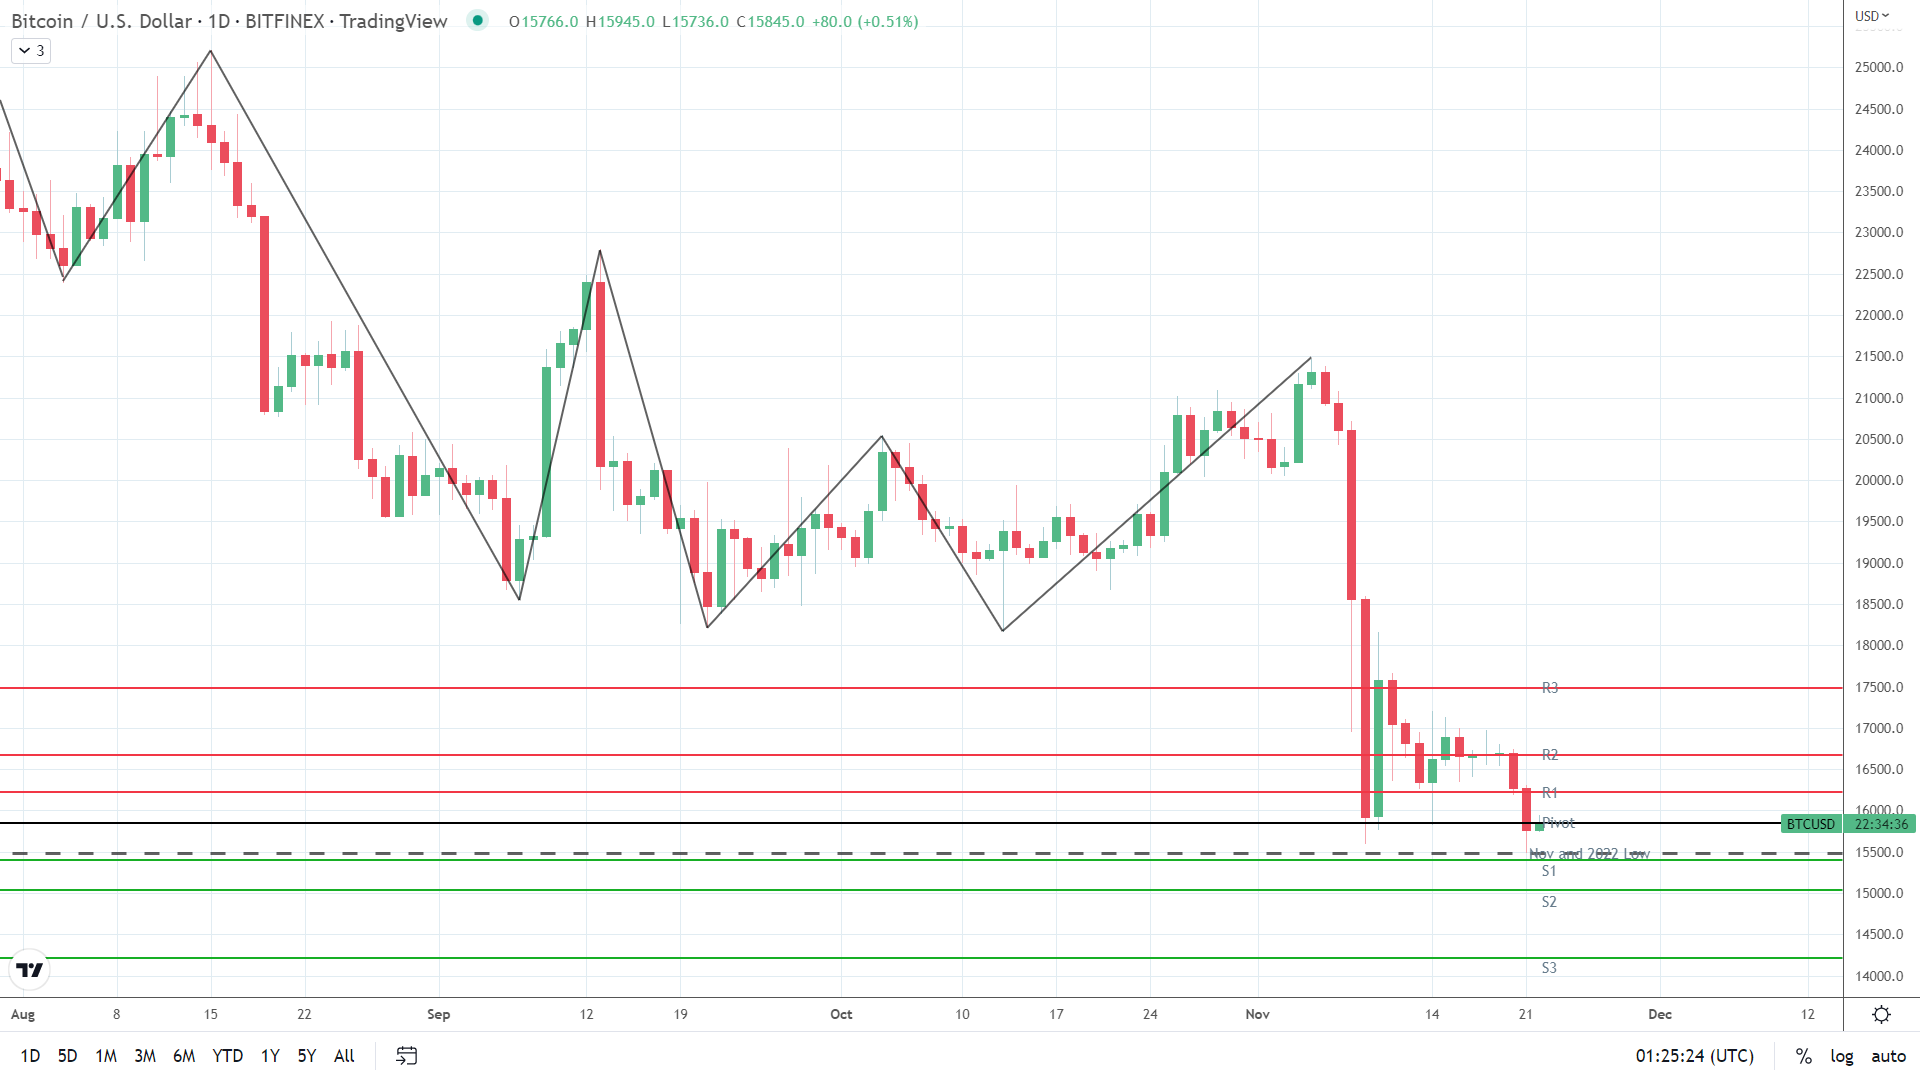
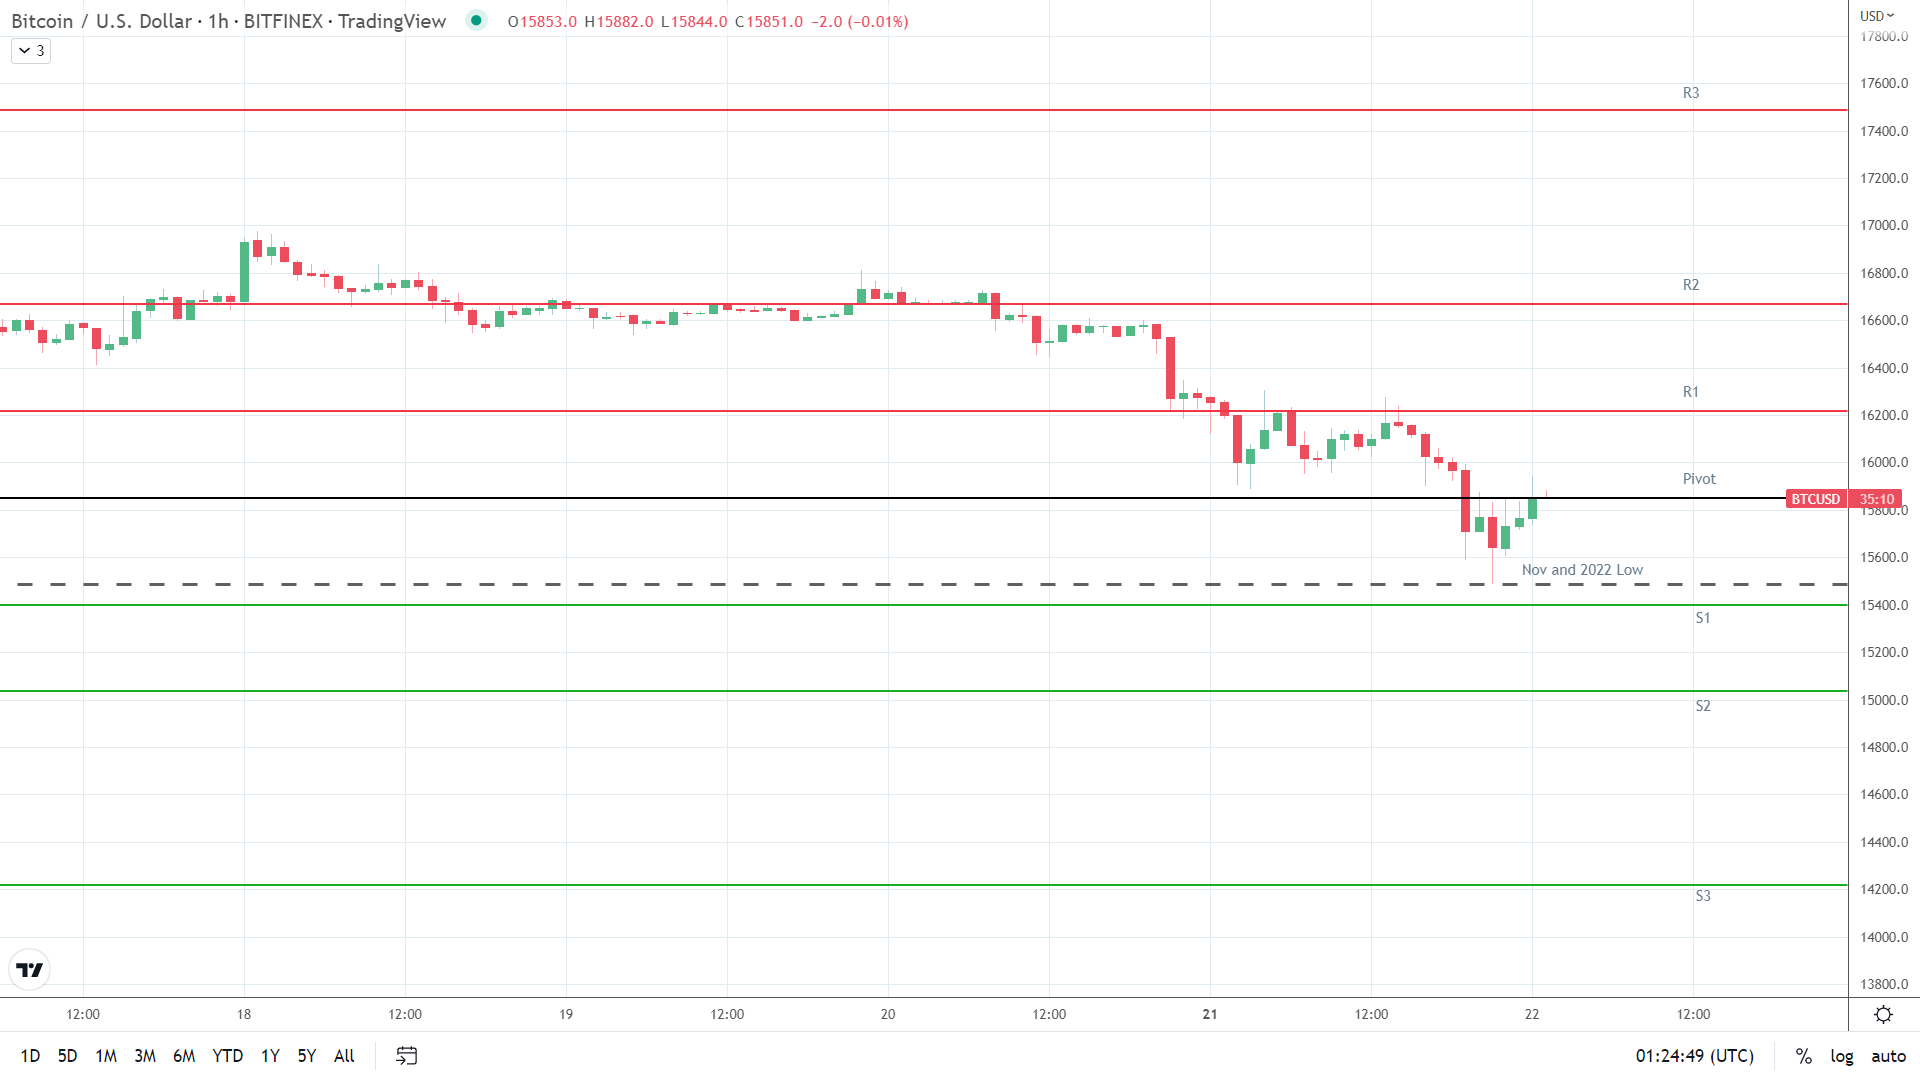
BTC needs to move through the $15,852 pivot to target the First Major Resistance Level (R1) at $16,218 and the Monday high of $16,305. A return to $16,000 would signal a bullish session. However, news updates have to be market-friendly to support a breakout session.
In the event of an extended rally, BTC would likely test resistance at $16,500 and the Second Major Resistance Level (R2) at $16,670.
The Third Major Resistance Level (R3) sits at $17,488.
Failure to move through the pivot would leave the First Major Support Level (S1) at $15,400 in play. Barring another extended sell-off, BTC should avoid sub-$15,000. The Second Major Support Level (S2) at $15,034 should limit the downside. However, negative FTX-related news could send BTC to sub-$15,000.
The Third Major Support Level (S3) sits at $14,216.
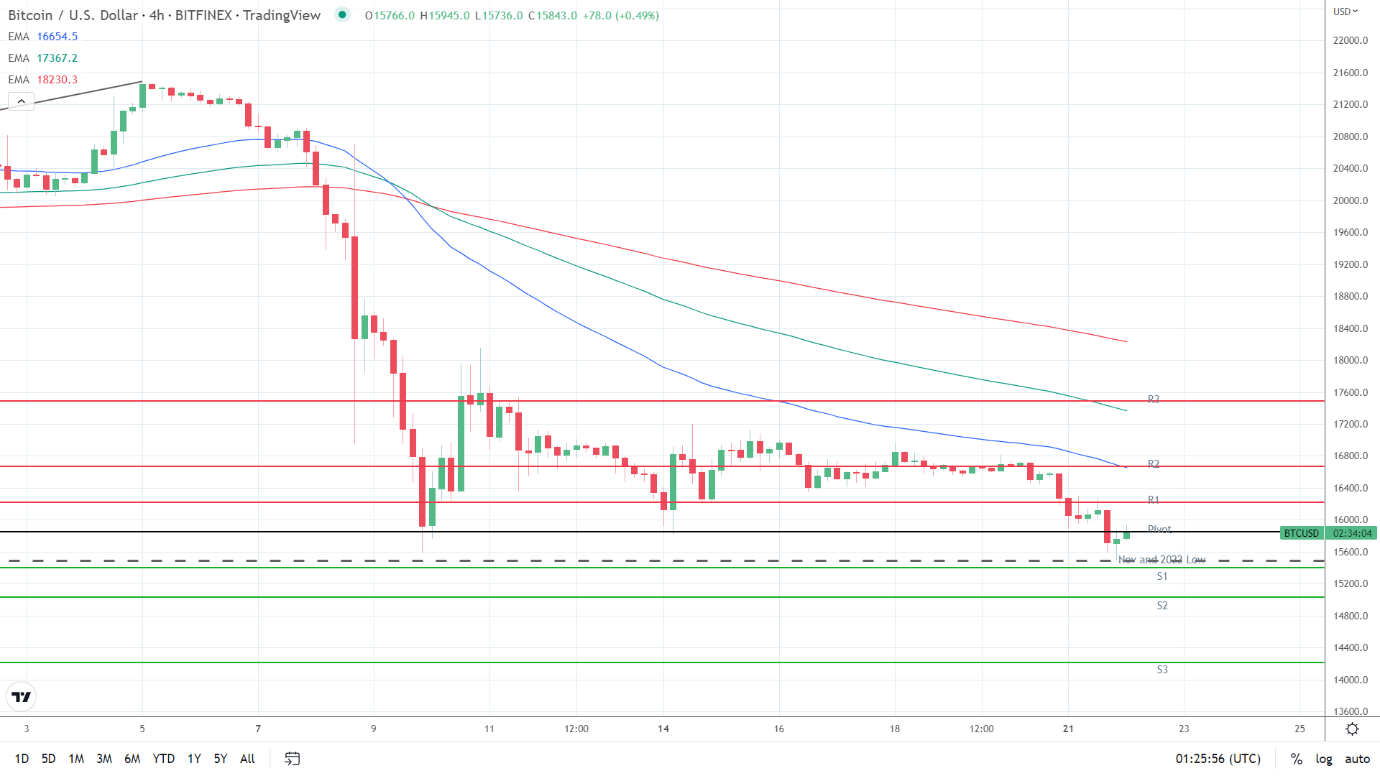
Looking at the EMAs and the 4-hourly candlestick chart (below), it was a bearish signal. This morning, bitcoin sat below the 50-day EMA, currently at $16,655. The 50-day EMA fell back from the 200-day EMA, with the 100-day EMA easing back from the 200-day EMA, delivering bearish signals.
A BTC move through R1 ($16,218) would give the bulls a run at the 50-day EMA ($16,655) and R2 ($16,670). However, failure to move through the 50-day EMA would leave S1 ($15,400) in play.