
BTC-Spot ETF Inflows Bolster Bullish Momentum
Bitcoin (BTC) gained 0.46% on Saturday, May 24, partially reversing Friday’s 3.79% loss to close at $107,855. Despite the recent volatility, BTC held above $100,000 for the sixteenth session.
US BTC-spot ETF market inflows have been crucial to BTC’s price trends. In the week ending May 23, BTC-spot ETF issuers reported total net inflows of $2,750.2 million, taking May’s net inflows to $5,377 million.

BlackRock’s Rising Influence
BlackRock’s (BLK) iShares Bitcoin Trust (IBIT) continued dominating, with net inflows of $2,432 million in the week and $5,330 million in May. Meanwhile, Fidelity Wise Origin Bitcoin Fund (FBTC) had net inflows of just $179.6 million in May after weekly inflows of $209.9 million.
ETF Store President Nate Geraci remarked on IBIT’s dominance, stating:
“iShares Bitcoin ETF now w/ inflows 28 of past 29 trading days… Nearly $8.5bil in new $$$. $10.7bil inflows this year, which is top 5 out of 4,200+ ETFs. IBIT also now over $70bil in total assets. Top 25 out of all ETFs. Just ridiculous numbers in 16 months since launch.”
This month, BlackRock became the second largest BTC holder, with the potential to flip Satoshi Nakamoto for the #1 spot. As of May 19, BlackRock had 636,108 BTC compared with Satoshi’s 1,123,500.
Expectations of longer-term capital entering the ETF space from sovereign wealth funds, teacher pension funds, or insurance companies could send BlackRock to first place sooner rather than later.
Bitcoin Price Forecast
Every new Bitcoin analysis as it publishes, today's technical signal and key levels, live price — on one page.
See all Bitcoin forecastsBTC Price Outlook: Key Drivers
BTC’s near-term trends hinge on several key macro and market drivers:
- Trade headlines will likely influence risk sentiment and broader crypto market trends.
- Headlines related to the Bitcoin Act.
- US economic data, the Fed rate path, and US recession risk.
- US BTC-spot ETF flows remain crucial to near-term price trends.
BTC Price Scenarios:
- Bullish Scenario: Easing trade tensions, dovish Fed bets, Bitcoin Act support, and strong ETF inflows may drive BTC toward $115,000.
- Bearish Scenario: Rising trade tensions, hawkish Fed cues, legislative gridlock, or ETF outflows could drag BTC toward $95,000.
Track live ETF flows and market sentiment here for insights into macro trends, regulation, and ETF data.
Technical Analysis
Bitcoin Analysis
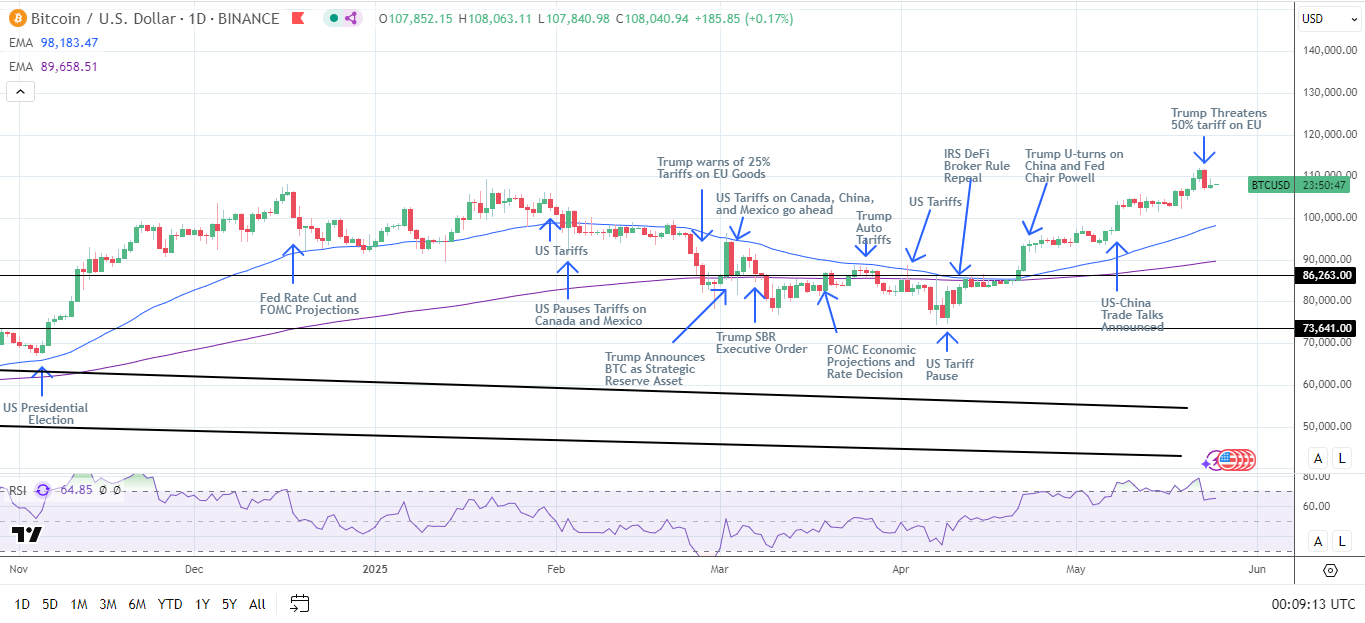
BTC trades above the 50-day and the 200-day Exponential Moving Averages (EMA), reaffirming bullish momentum.
- Upside Target: A break above the May 22 high of $111,917 could pave the way to $115,000. A decisive move beyond $115,000 may bring $120,000 into view.
- Downside Risk: A drop below $100,000 could send BTC toward the 50-day EMA. Increasing selling pressure may expose the $90,742 support level if $95,000 fails to hold.
The 14-day Relative Strength Index (RSI) at 64.85 shows BTC has room to climb to $111,917 before entering overbought territory (RSI > 70).
Stay ahead of market trends by accessing real-time BTC price data and technical indicators here.
ETH in Focus: Ethereum Analysis
Turning to ethereum (ETH), ETH also steadied after Friday’s reversal.
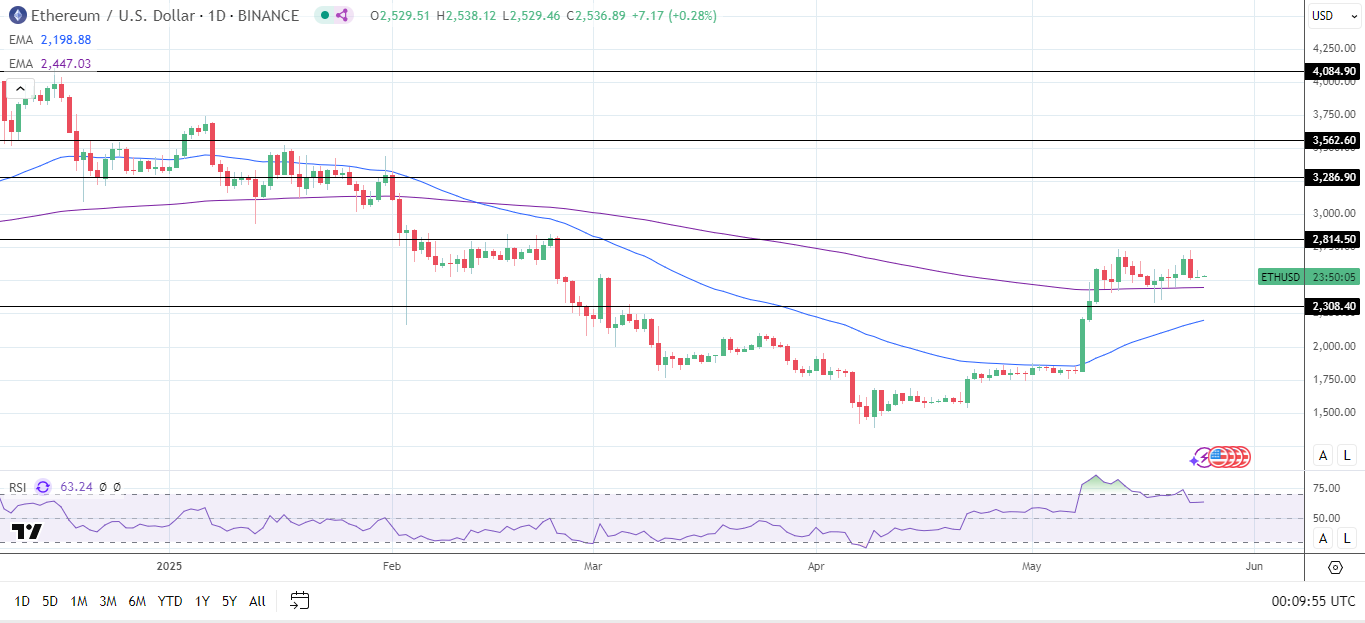
ETH remains above the 50-day and 200-day EMAs, reaffirming bullish momentum.
- Upside target: A breakout above the May 23 high of $2,732 could enable the bulls to target the $2,815 resistance level. A sustained move above $2,815 may open the door to testing resistance at $3,000.
- Downside risks: If ETH drops below the 200-day EMA, the $2,308 support level would be the next key support level.
The 14-day Relative Strength Index (RSI) at 63.07 suggests ETH could climb to the May 23 high before entering overbought territory (RSI > 70).
Stay informed on BTC and ETH trends by tracking macroeconomic developments, ETF flows, and technical indicators here.