


Thursday Reversal Puts Key Support to the Test
WTI crude oil triggered a one-day reversal on Thursday, generating a higher daily low of $74.93 and a higher high of $78.50. This short-term sign of strength follows a new retracement low of $74.60 that was established during Wednesday’s session and a break below the 200-day moving average, now near $77.16. Support near that average was also validated by the first pullback low that followed the March peak of $119.54 and the midline of a falling trend channel that encompasses the current bearish corrective structure that developed after the March peak.
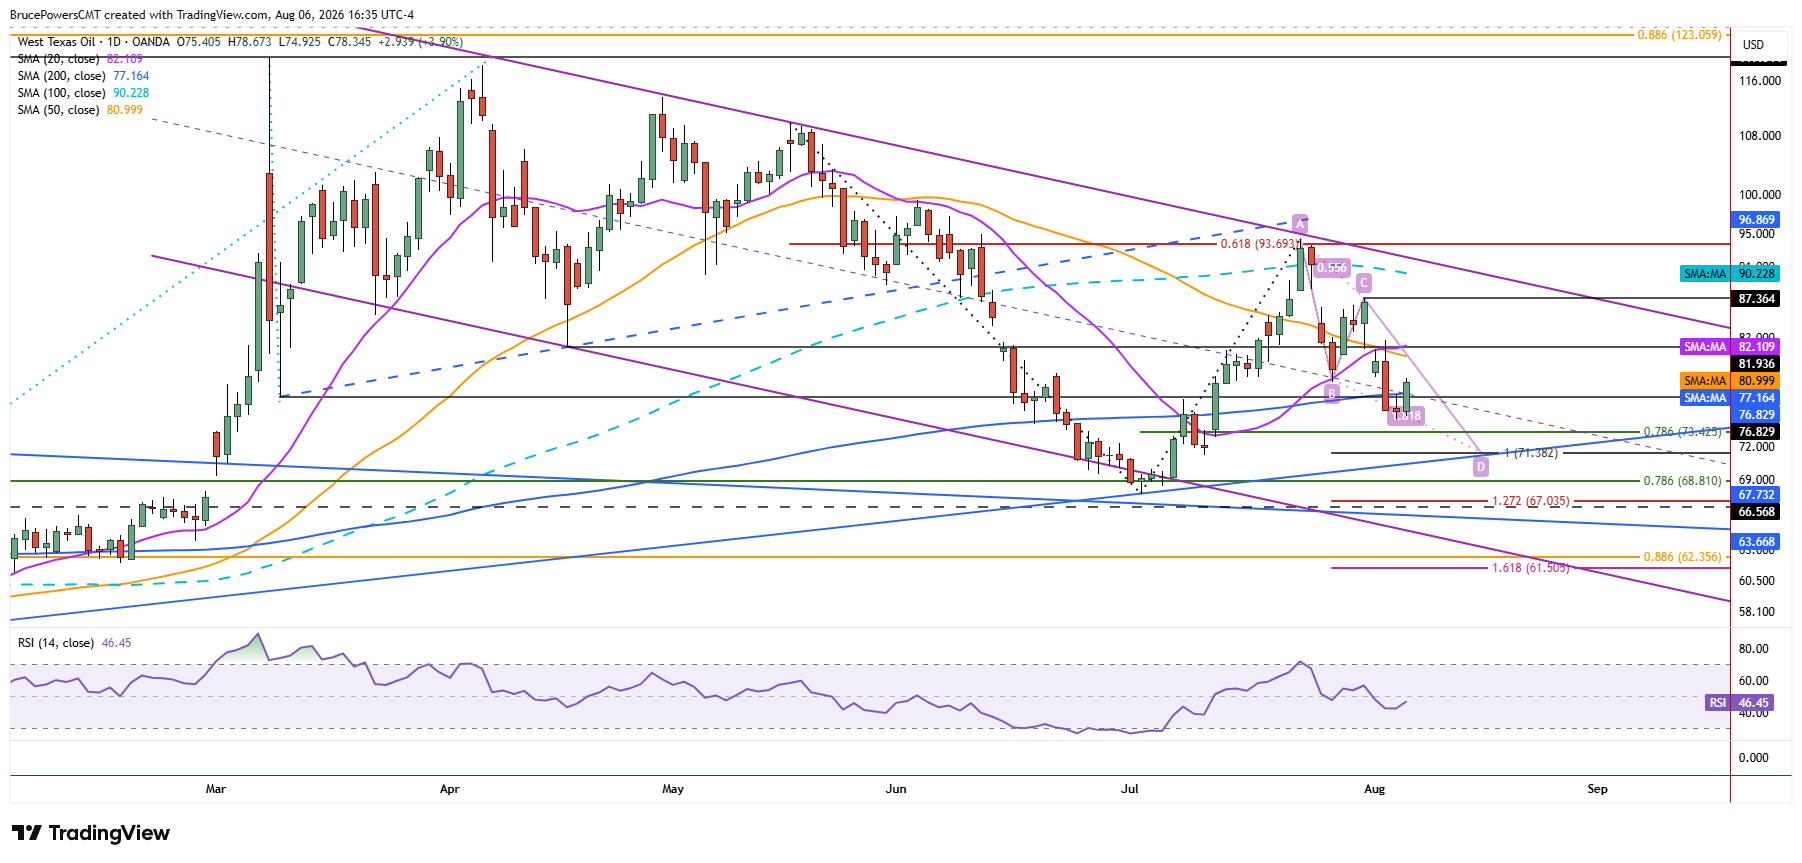
That confluence increases the significance of the 200-day moving average as a key pivot zone. A quick reclaim would indicate a failed break below the 200-day moving average. Failed moves in one direction can lead to fast moves in the opposite direction. Although there remains a downside target at the 78.6% Fibonacci retracement zone, continued trade above the 200-day moving average would lower that likelihood, at least until a higher low is established and price bounces toward initial upside targets.

Resistance Defines the Bullish Test
An initial target zone is indicated between $80.99 and $82.76, consisting of the 50-day moving average and a minor swing high at $82.76, respectively. The 20-day moving average is also within that price zone at $82.07, along with a prior swing low from April at $81.94. If the $82.76 high can be recovered, then the lower swing high at $87.36 becomes the next upside target. That would provide further evidence that Thursday’s reversal marked a more meaningful shift in the short-term trend.
Failure Keeps Deeper Targets Alive
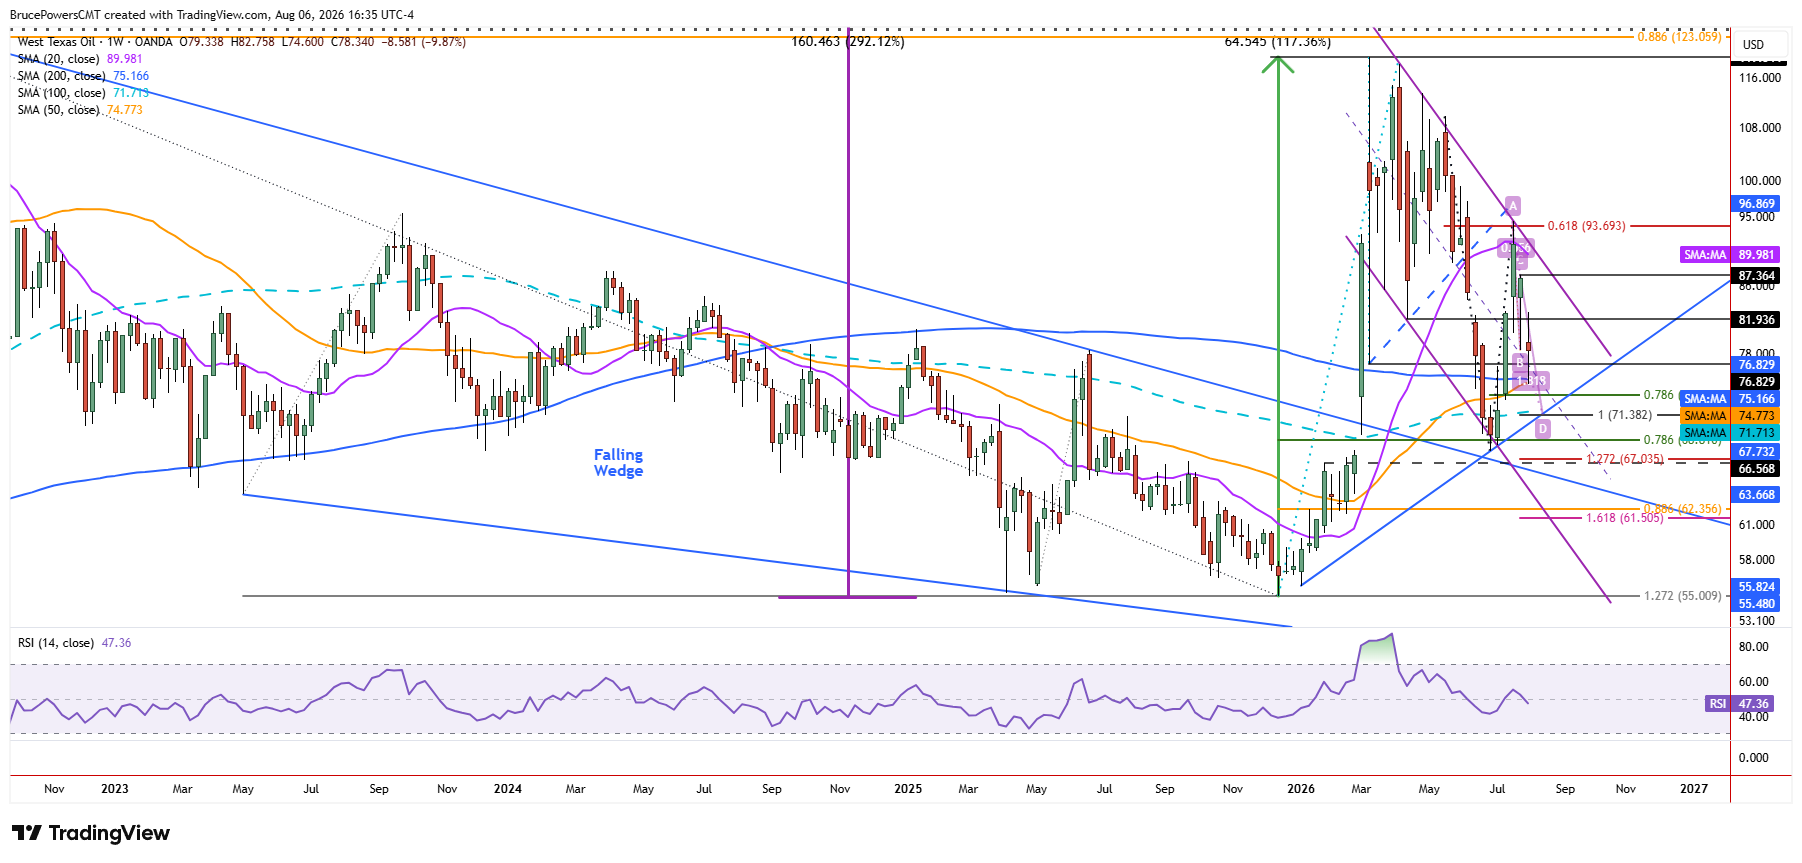
Alternatively, failure to recover that price zone could allow sellers to regain control and send crude oil
lower to retest support near the 200-day moving average. That could lead to a breakdown toward the 78.6% Fibonacci zone or a 100% projection for a falling ABCD pattern at $71.38. An uptrend line is also nearby, suggesting additional support in that area. For now, the 200-day moving average remains the key pivot: holding above it would strengthen the Thursday reversal, while another failure below it would keep the deeper bearish targets in play.
If you’d like to know more about how commodity markets work, please visit our educational area.



