Key Insights:
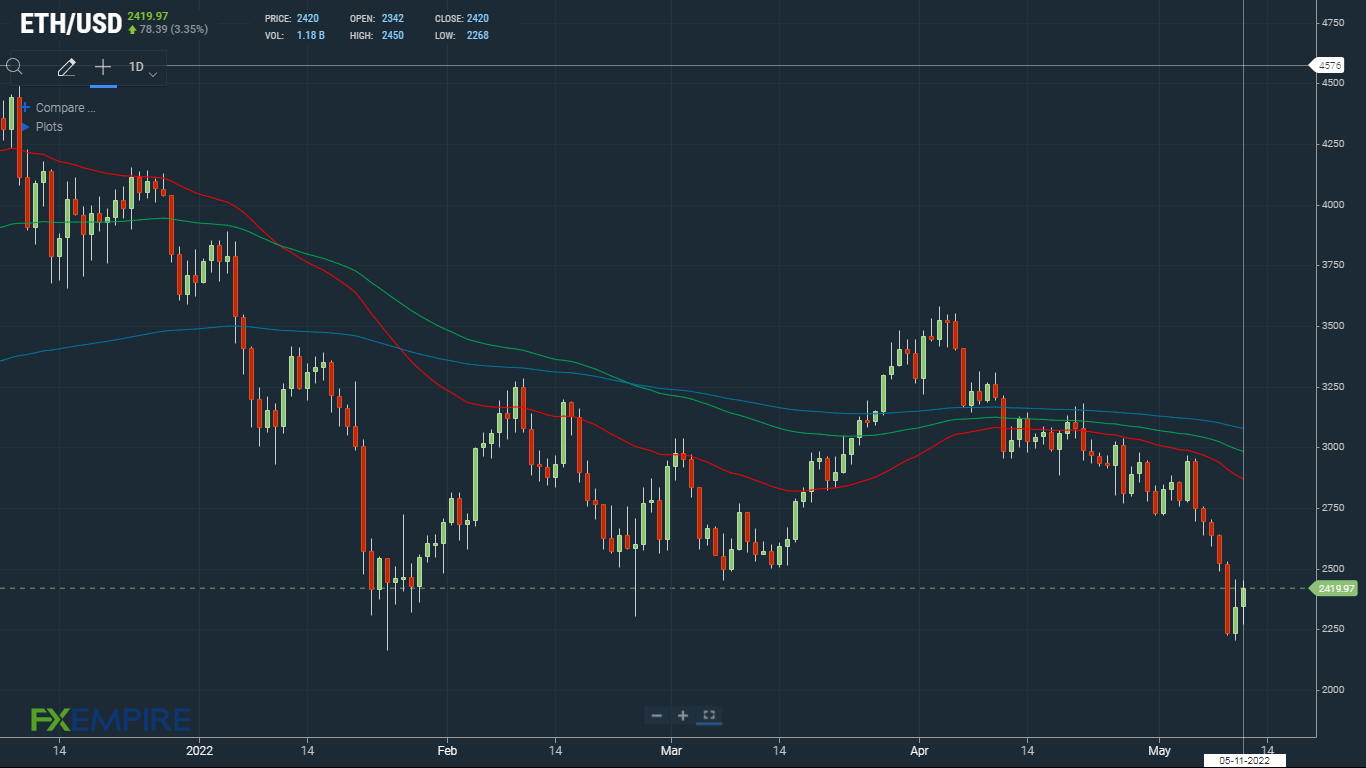
- On Tuesday, Ethereum (ETH) tested support at $2,200 before finding support to end the day up 5%.
- Bullish sentiment from across the broader market kicked in after Monday’s extended sell-off.
- Technical indicators remain bearish, with ETH sitting below the 50-day EMA.
Ethereum (ETH) rose by 4.98% on Tuesday. Partially reversing an 11.43% slide from Monday, ETH ended the day at $2,342.
A bearish start to the day saw ETH slide to a morning low of $2,201 before making a move.

A Shift in Investor Sentiment Towards US Inflation Delivers Support
Following a global equity market rout on Monday, US equities found much-needed support on Tuesday.
With the correlation between the NASDAQ 100 and bitcoin (BTC) strengthening in recent weeks, the crypto market took its cues from BTC on the day.
BTC rose by 3.11%, supported by a NASDAQ gain of 0.98%. The NASDAQ 100 tumbled by 4.29% on Monday, weighing on the crypto market.
However, the crypto relief rally was modest, with market angst over the TerraUSD UST de-pegging from the dollar testing investor resilience.
Ethereum Price Forecast
Every new Ethereum analysis as it publishes, today's technical signal and key levels, live price — on one page.
See all Ethereum forecastsEthereum (ETH) Price Action
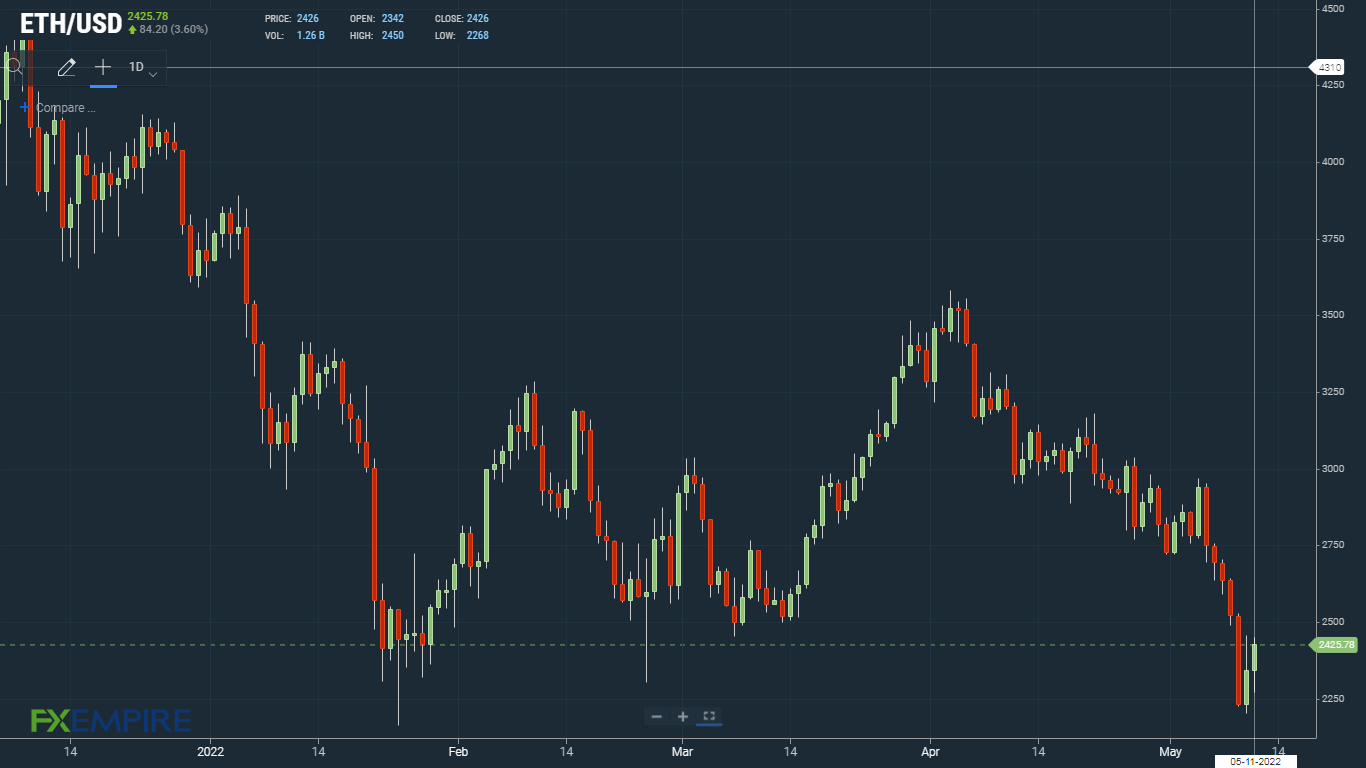
At the time of writing, Ethereum (ETH) was up 3.60% to $2,426. A mixed start to the day saw ETH fall to an early morning low of $2,268 before striking a high of $2,450.
Technical Indicators
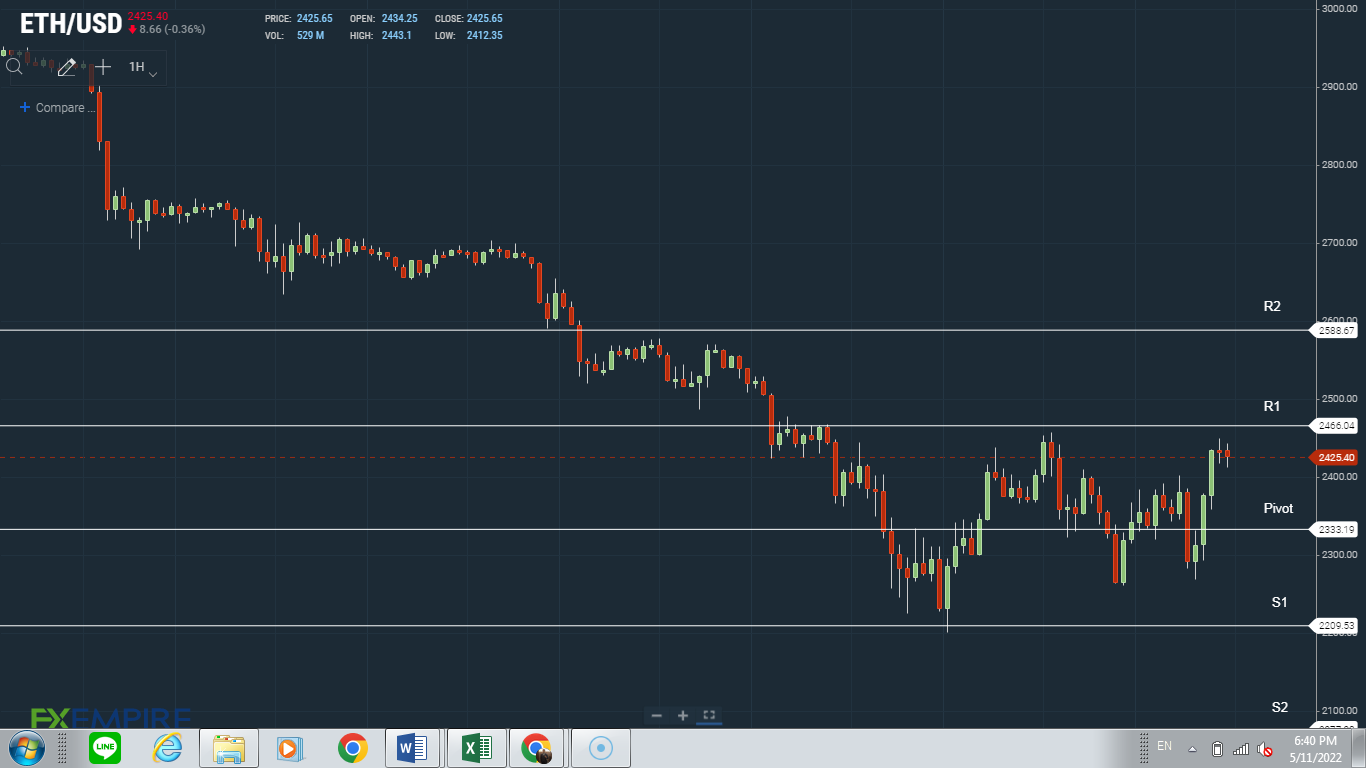
ETH will need to avoid the $2,333 pivot to target the First Major Resistance Level at $2,466.
Broader market sentiment would need to improve to support a breakout from the morning high of $2,450.
In the event of an extended rally, ETH should test the Second Major Resistance Level at $2,589. The Third Major Resistance Level sits at $2,845.
A fall through the pivot would bring the First Major Support Level at $2,210 back into play. Barring another extended sell-off throughout the day, ETH should avoid sub-$2,000. The Second Major Support Level at $2,077 should limit the downside.
The EMAs and the 4-hourly candlestick chart (below) send a bearish signal. ETH sits below the 50-day EMA, currently at $2,871. This morning, the 50-day EMA pulled back from the 100-day EMA. The 100-day EMA also pulled back from the 200-day EMA, a bearish signal.
A move through the 50-day EMA would bring $3,000 into play.