AUD/USD Technical Analysis
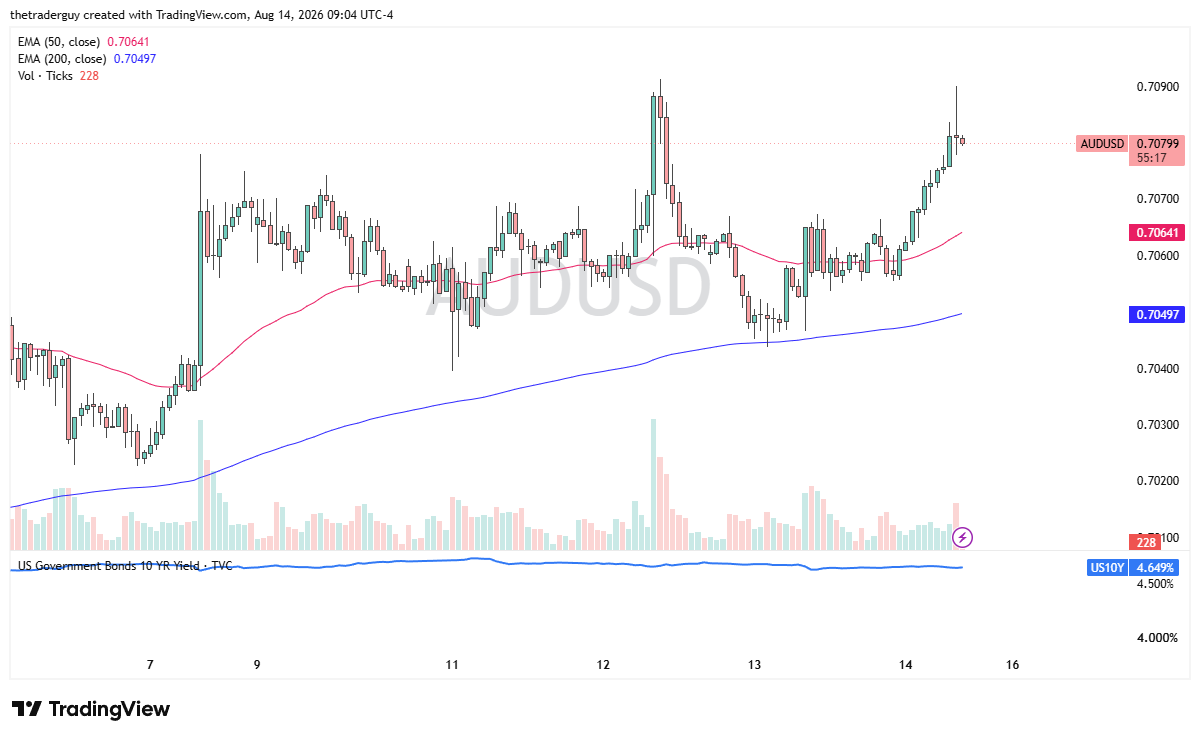
The Australian dollar has stretched towards the 0.7090 level during the trading session here on Friday, but is starting to give back some of those gains. And this is an area that has been resistant previously. A pullback at this point in time would not necessarily be the most surprising outcome.
And when we look at the overall market going back several weeks, we can see that this area back in the middle of June had been a swing high before we really broke down. The question now is whether or not we have enough momentum to go forward. It will possibly be driven by interest rates in America. Are they going up or down, making the dollar less or more attractive? And the headline risk over the weekend. How much risk do people want to put on?

NZD/USD Technical Analysis
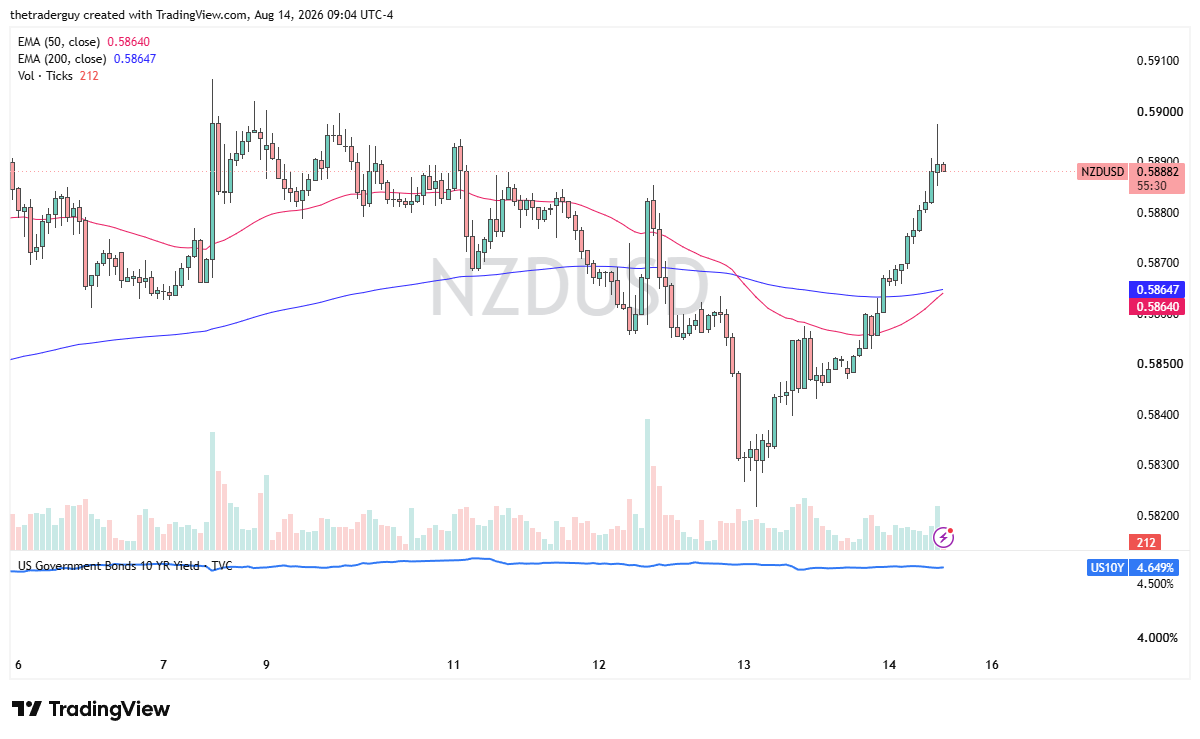
The New Zealand dollar looks very much the same, hanging around the 0.59 level. It looks like it’s struggling a bit over the last hour or so. Pullback wouldn’t be the most shocking thing here either. Quite frankly, though, this one has been in a relatively tight range for a while, so we’re now getting to the top of the consolidation area that we had broken out of. A lot of noisy trading, but New Zealand is highly sensitive to what goes on in the Strait of Hormuz, especially from an energy standpoint, and right now there isn’t much going on, so I think that is one concern.
The RBNZ is expected to raise rates again, but so is the Federal Reserve. It’ll be interesting to see how that plays out. Recently, the US economic numbers have been a little softer. People are starting to temper down the bets on the Fed raising rates, so that’s part of what’s going on here.
USD/CAD Technical Analysis
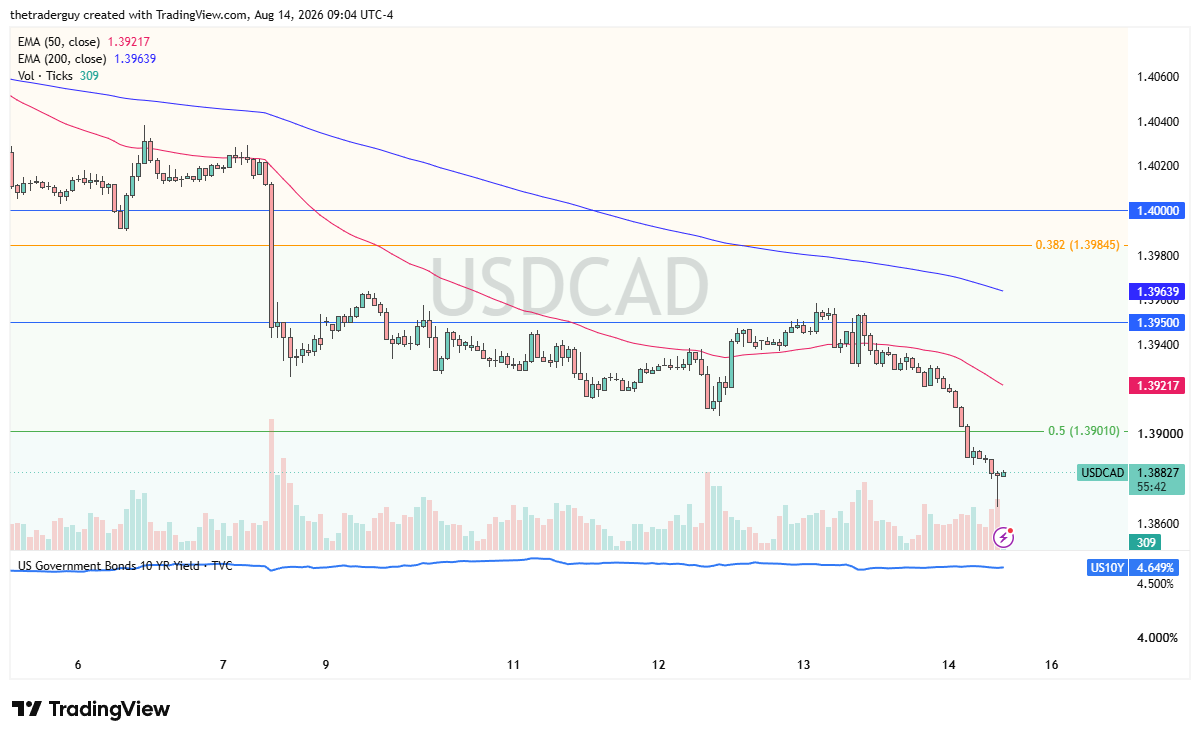
And we have the US dollar against the Canadian dollar. It continues to look weak over the last, we’ll say, 2 weeks or so, but we are now starting to approach the so-called golden zone between the 50% Fibonacci retracement level and the 61.8% Fibonacci retracement level, a technical area a lot of people watch.
Whether or not people want to hold Canadian dollars over the US dollar heading into the weekend is an open-ended question, but it does look like there’s a little bit of pushback here. Still a downtrend over the last couple of days, though, so any bounce from here could attract selling pressure at the first signs of exhaustion. A break below the hammer on the hourly candlestick could open up a move towards the 1.3850 level, an area that’s seen noise in the past.
AUD/USD Price Forecast
Every new AUD/USD analysis as it publishes, today's technical signal and key levels, live price — on one page.
See all AUD/USD forecastsIf you’d like to know more about technical analysis and how traders use it, please visit our educational area.