Bullish Reversal Gains Momentum
After signs of resistance and a weak close on Tuesday, buyers took back control of gold on Wednesday to reach a slightly new high of $4,441. A potential bearish candlestick pattern from Tuesday did not trigger and a higher daily low of $4,362 was established instead. Gold is set to close above the lower swing high of $4,382 from mid June and above the 100-day moving average at $4,390, thereby confirming a bullish reversal signal and reclaim of a key moving average. Also, Wednesday’s close is set to be the highest for the current advance, providing an additional bullish indication.
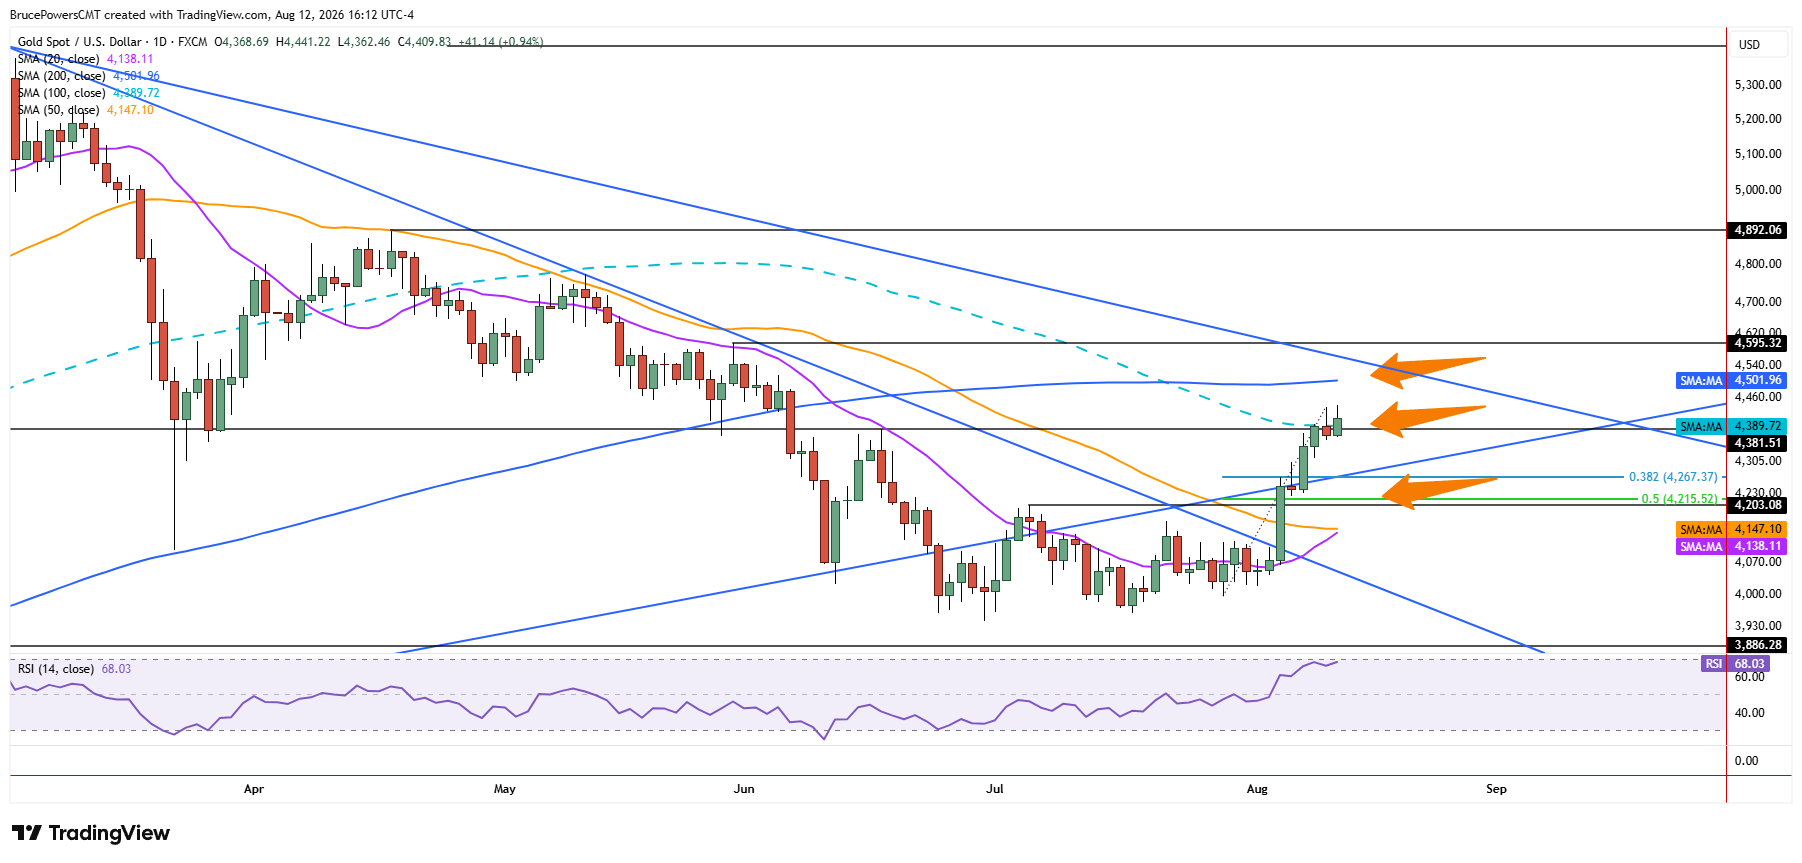
The fact that gold has not had a pullback below a prior day’s low since bullish momentum accelerated after a break above a downtrend line last Wednesday, is testament to the conviction of buyers. Therefore, if the current resistance zone is cleared, it looks like gold may head to its next upside target before a pullback.

Momentum Points Toward $4,502
The 200-day moving average is a key potential resistance zone and it sits currently near $4,502. It has not been successfully tested as resistance since a break below it occurred in early June, other than an initial pullback. Given the position and strength of the advance, it looks likely to be tested before gold is done with the current overall advance. This doesn’t mean there is not consolidation or a pullback first, but there is also the possibility that the 200-day average is reached before that occurs.
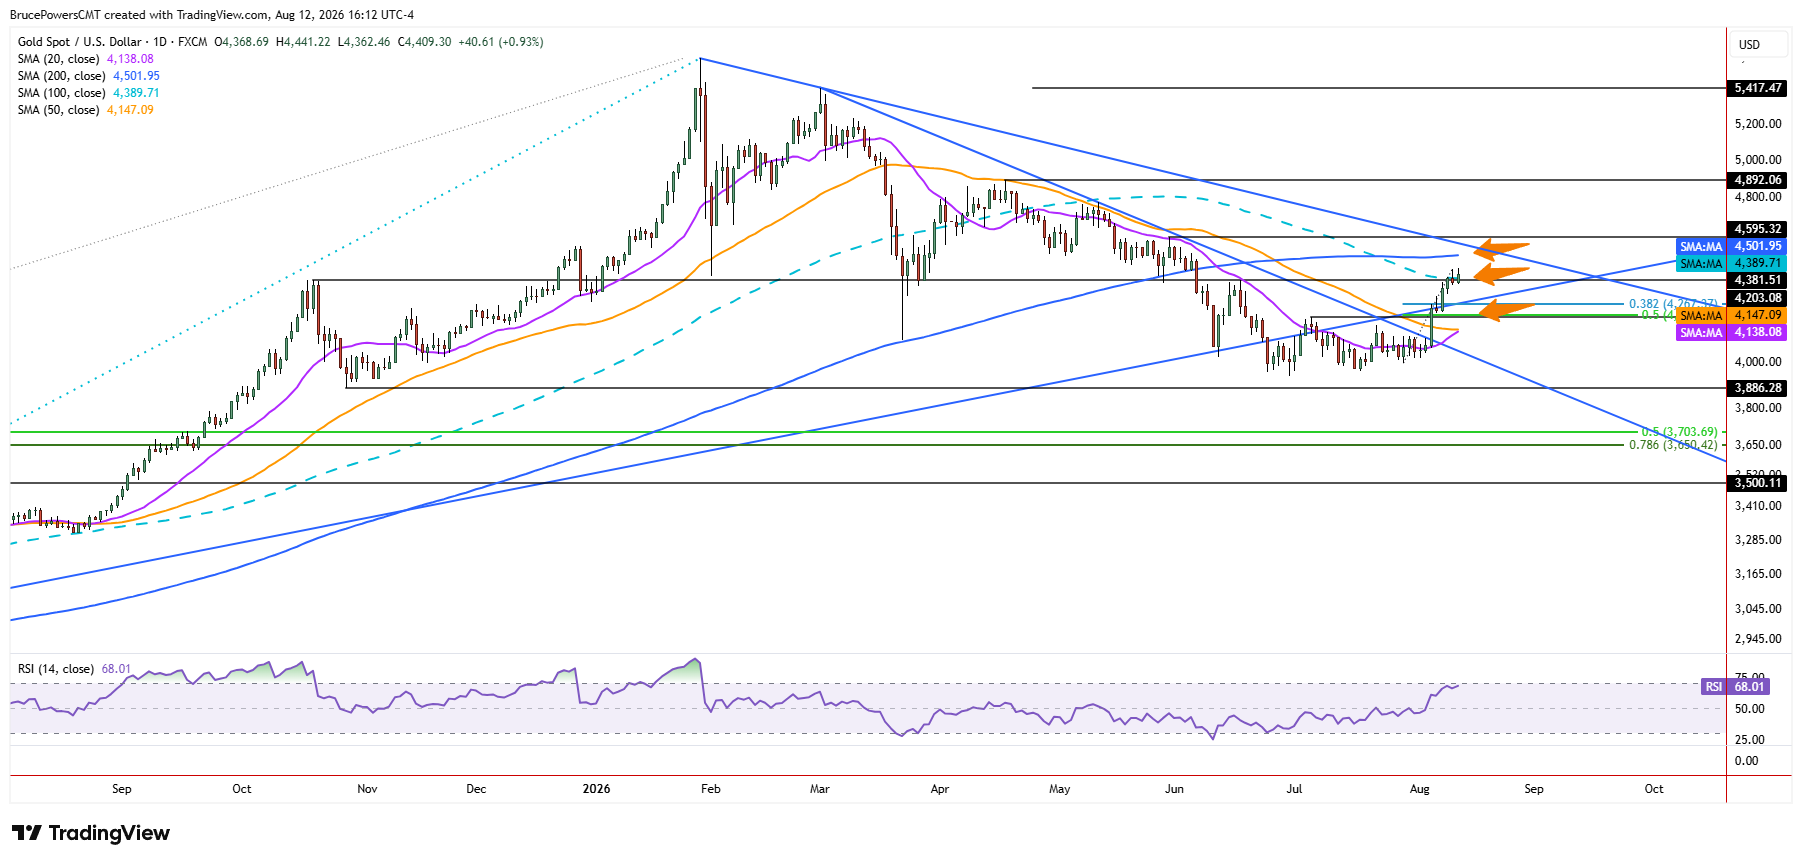
A sustained reclaim of the 100-day moving average goes a long way towards reaching the 200-day average. The first approach is expected to be met with resistance, further supported by a downtrend line. If the 200-day moving average is reached and followed by weakness, the 100-day moving average will represent a key dynamic initial support area.
Longer-Term Trend Faces Next Test
With a test of the 200-day moving average, the downtrend line may also be tested as resistance, along with an interim lower swing high from late May at $4,595. The recovery above the long-term uptrend line recently is positive for the long-term trend. To further satisfy the bulls, a reclaim of the 200-day moving average will also need to occur.
If you’d like to know more about how to trade gold and silver, please visit our educational area.