Gold Finds Investor Support as December Hike Risk Lingers
Even as the Fed’s policy tightening limits gold’s upside potential, investor demand for the yellow metal remains. In India, regulators are trying to moderate gold buying ahead of Diwali.

Gold: Rates Cap, Investors Accumulate
Higher rates cap gold prices, and ahead of the FOMC meeting on October 27–28, gold prices slid. CME’s FedWatch shows an 83% likelihood of a hold this month and a 94% likelihood of at least one hike by December, according to Reuters.
However, investors have been buying the metal. According to BullionVault, gold ETF shares grew 0.3% last week, requiring a record 4,278 tonnes of bullion backing. Demand has become more broad-based. Heraeus reports that in the 12 months to September, Asian-listed funds accounted for almost 50% of the increase in global gold ETF holdings.
India is pushing back. Kotak Mahindra, UTI and HDFC mutual funds paused large new inflows into their gold ETFs after discussions with market regulator SEBI, according to Reuters. The move is seen as a precaution against a festive jump in bullion imports ahead of Diwali, with the rupee under pressure.
Not every central bank is buying. Kazakhstan plans to reduce gold’s share of its reserves to 75% from about 78% by the end of the year. Its gold reserves stand at 386 tonnes. Heraeus said this was more of a portfolio rebalancing than a sign of broader official selling.
Gold Price Forecast
Every new Gold analysis as it publishes, today's technical signal and key levels, live price — on one page.
See all Gold forecastsSilver: Pressured by Rates, Lifted by Asian Demand
Rising US inflation and expectations of further Federal Reserve tightening pressured silver last week. However, on Tuesday, stronger physical demand signals from China and India lifted both metals, with silver outpacing gold, according to BullionVault. Shanghai prices implied an import premium of about $22 an ounce, roughly three times the usual incentive, showing once again that Asian demand is a major factor in offsetting interest-rate pressure.
Gold Technical Analysis: XAU/USD Slips Below $4,154 as $4,083 Support Comes Into Focus
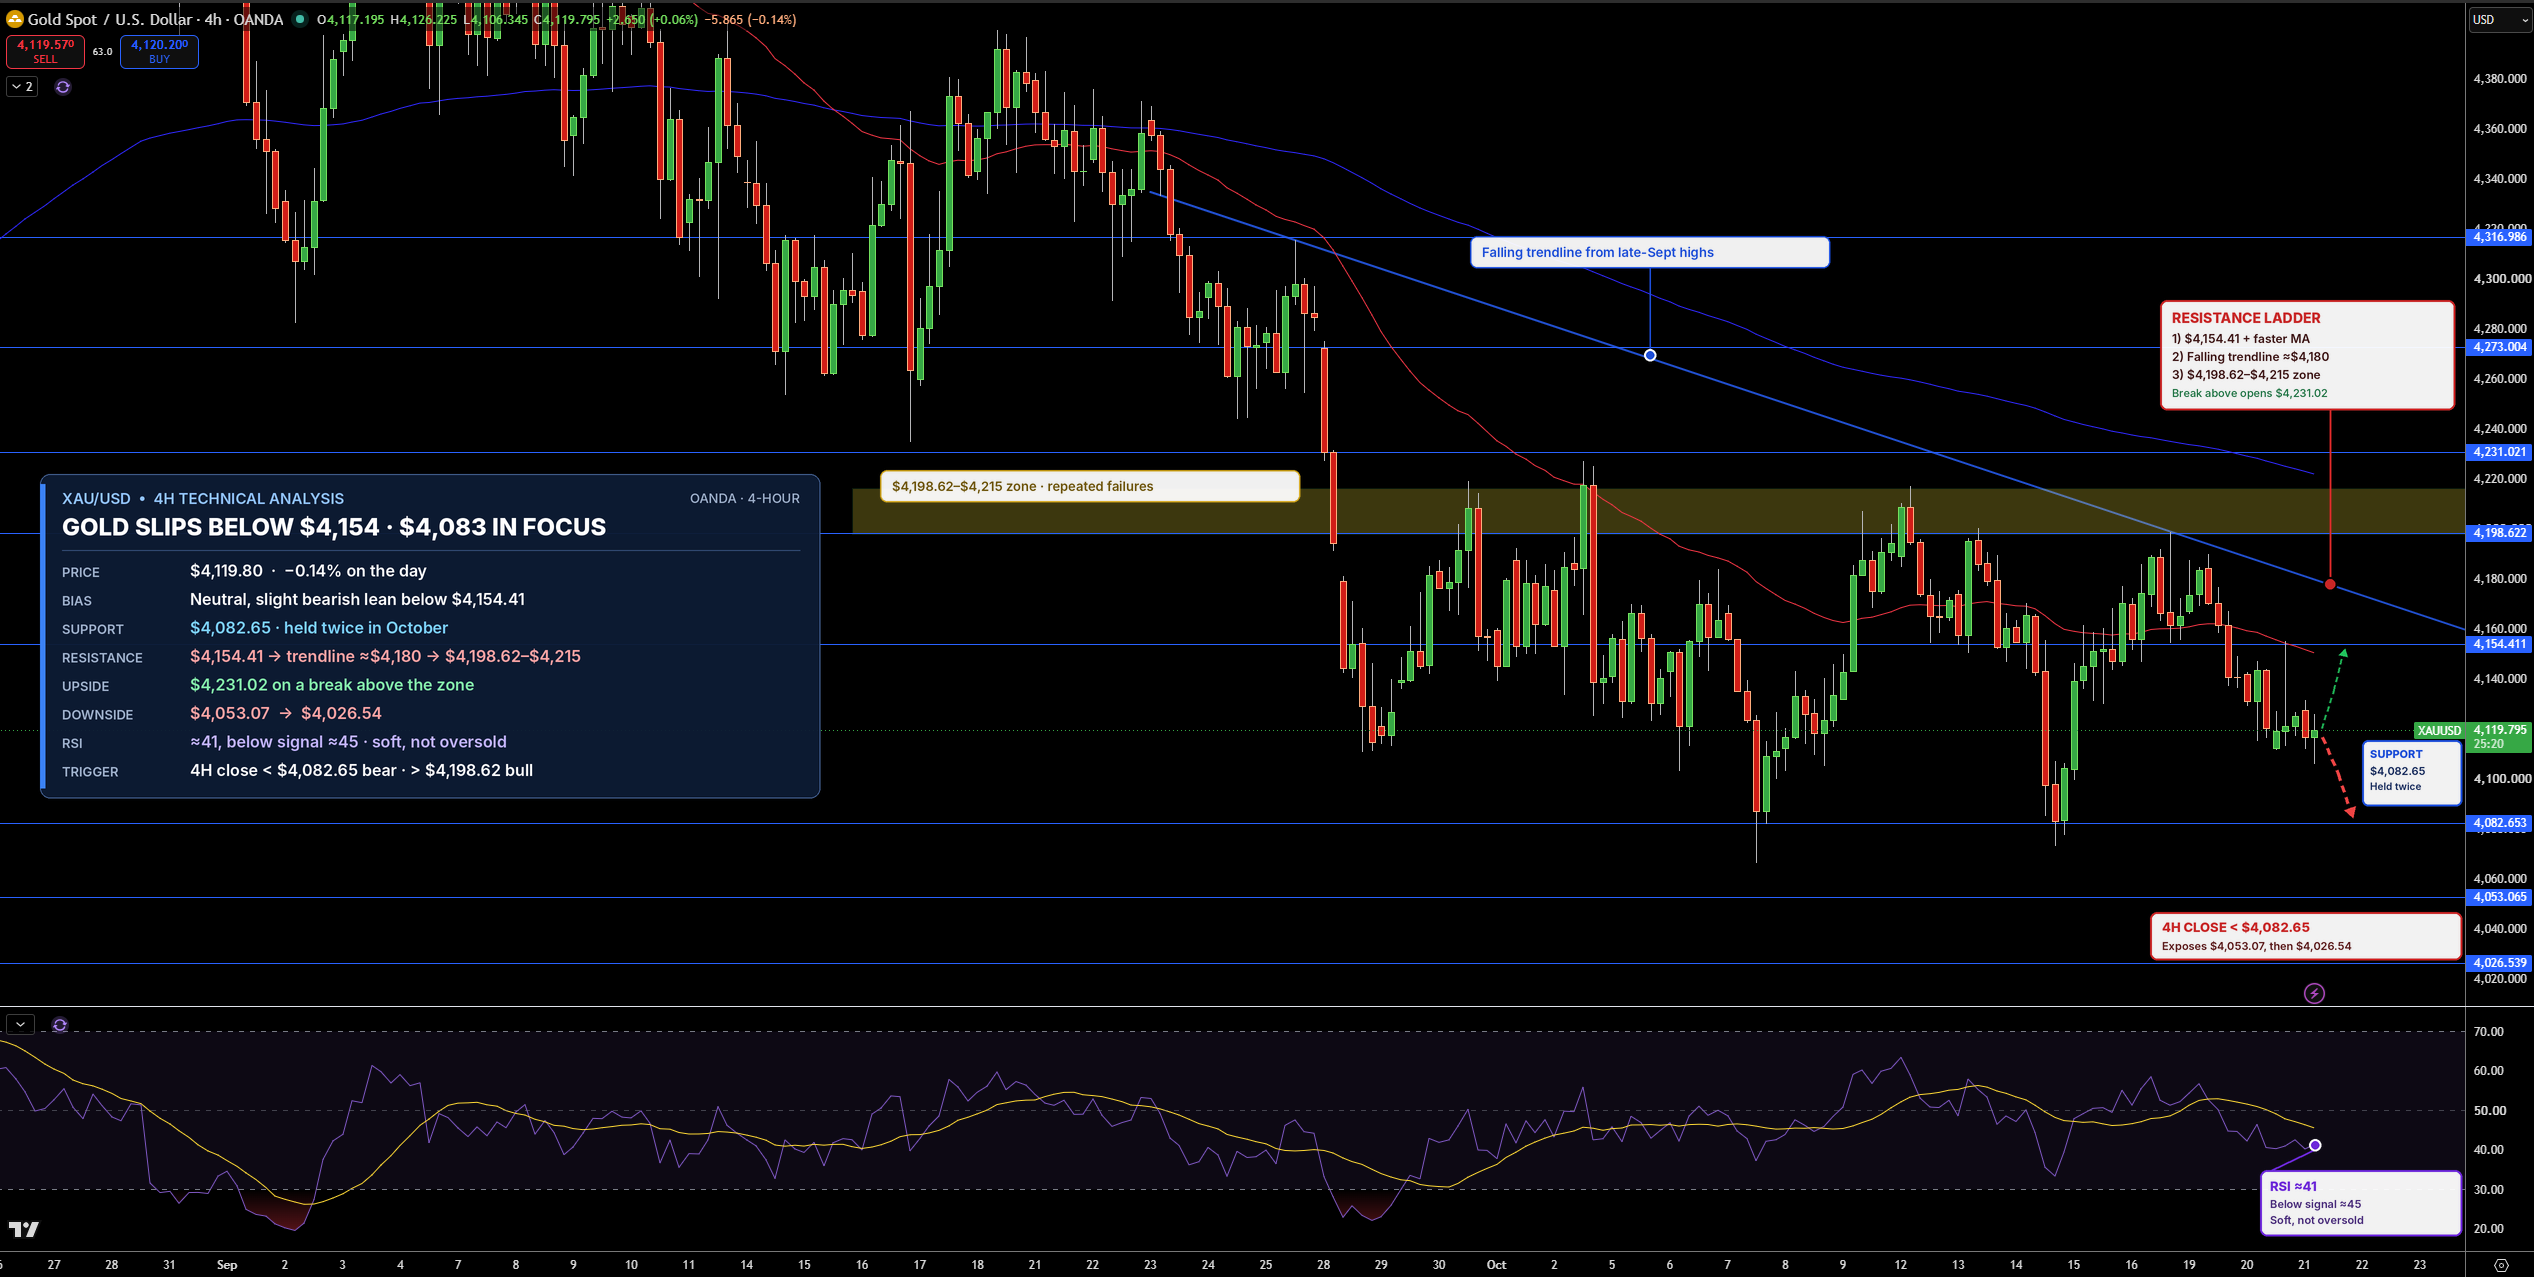
Gold is currently trading near $4,120 on the 4-hour chart. What grabs my attention is the falling trendline that has limited each rally since late September, leaving a series of lower highs. Price is also below both moving averages, suggesting sellers are in control.
The first support is $4,083, which has been tested twice this month. A break below $4,083 could lead to $4,053. Resistance is located at $4,154, followed by the falling trendline near $4,180 and $4,199.
RSI is near 41 and below its signal line. This suggests momentum is weakening but not oversold. I am neutral with a slight bearish bias as long as gold stays below $4,154. A break above $4,199 will be a positive sign, and a close below $4,083 will strengthen the bearish bias.
Silver Technical Analysis: XAG/USD Tests $57.39 as Triangle Support Comes Into Focus
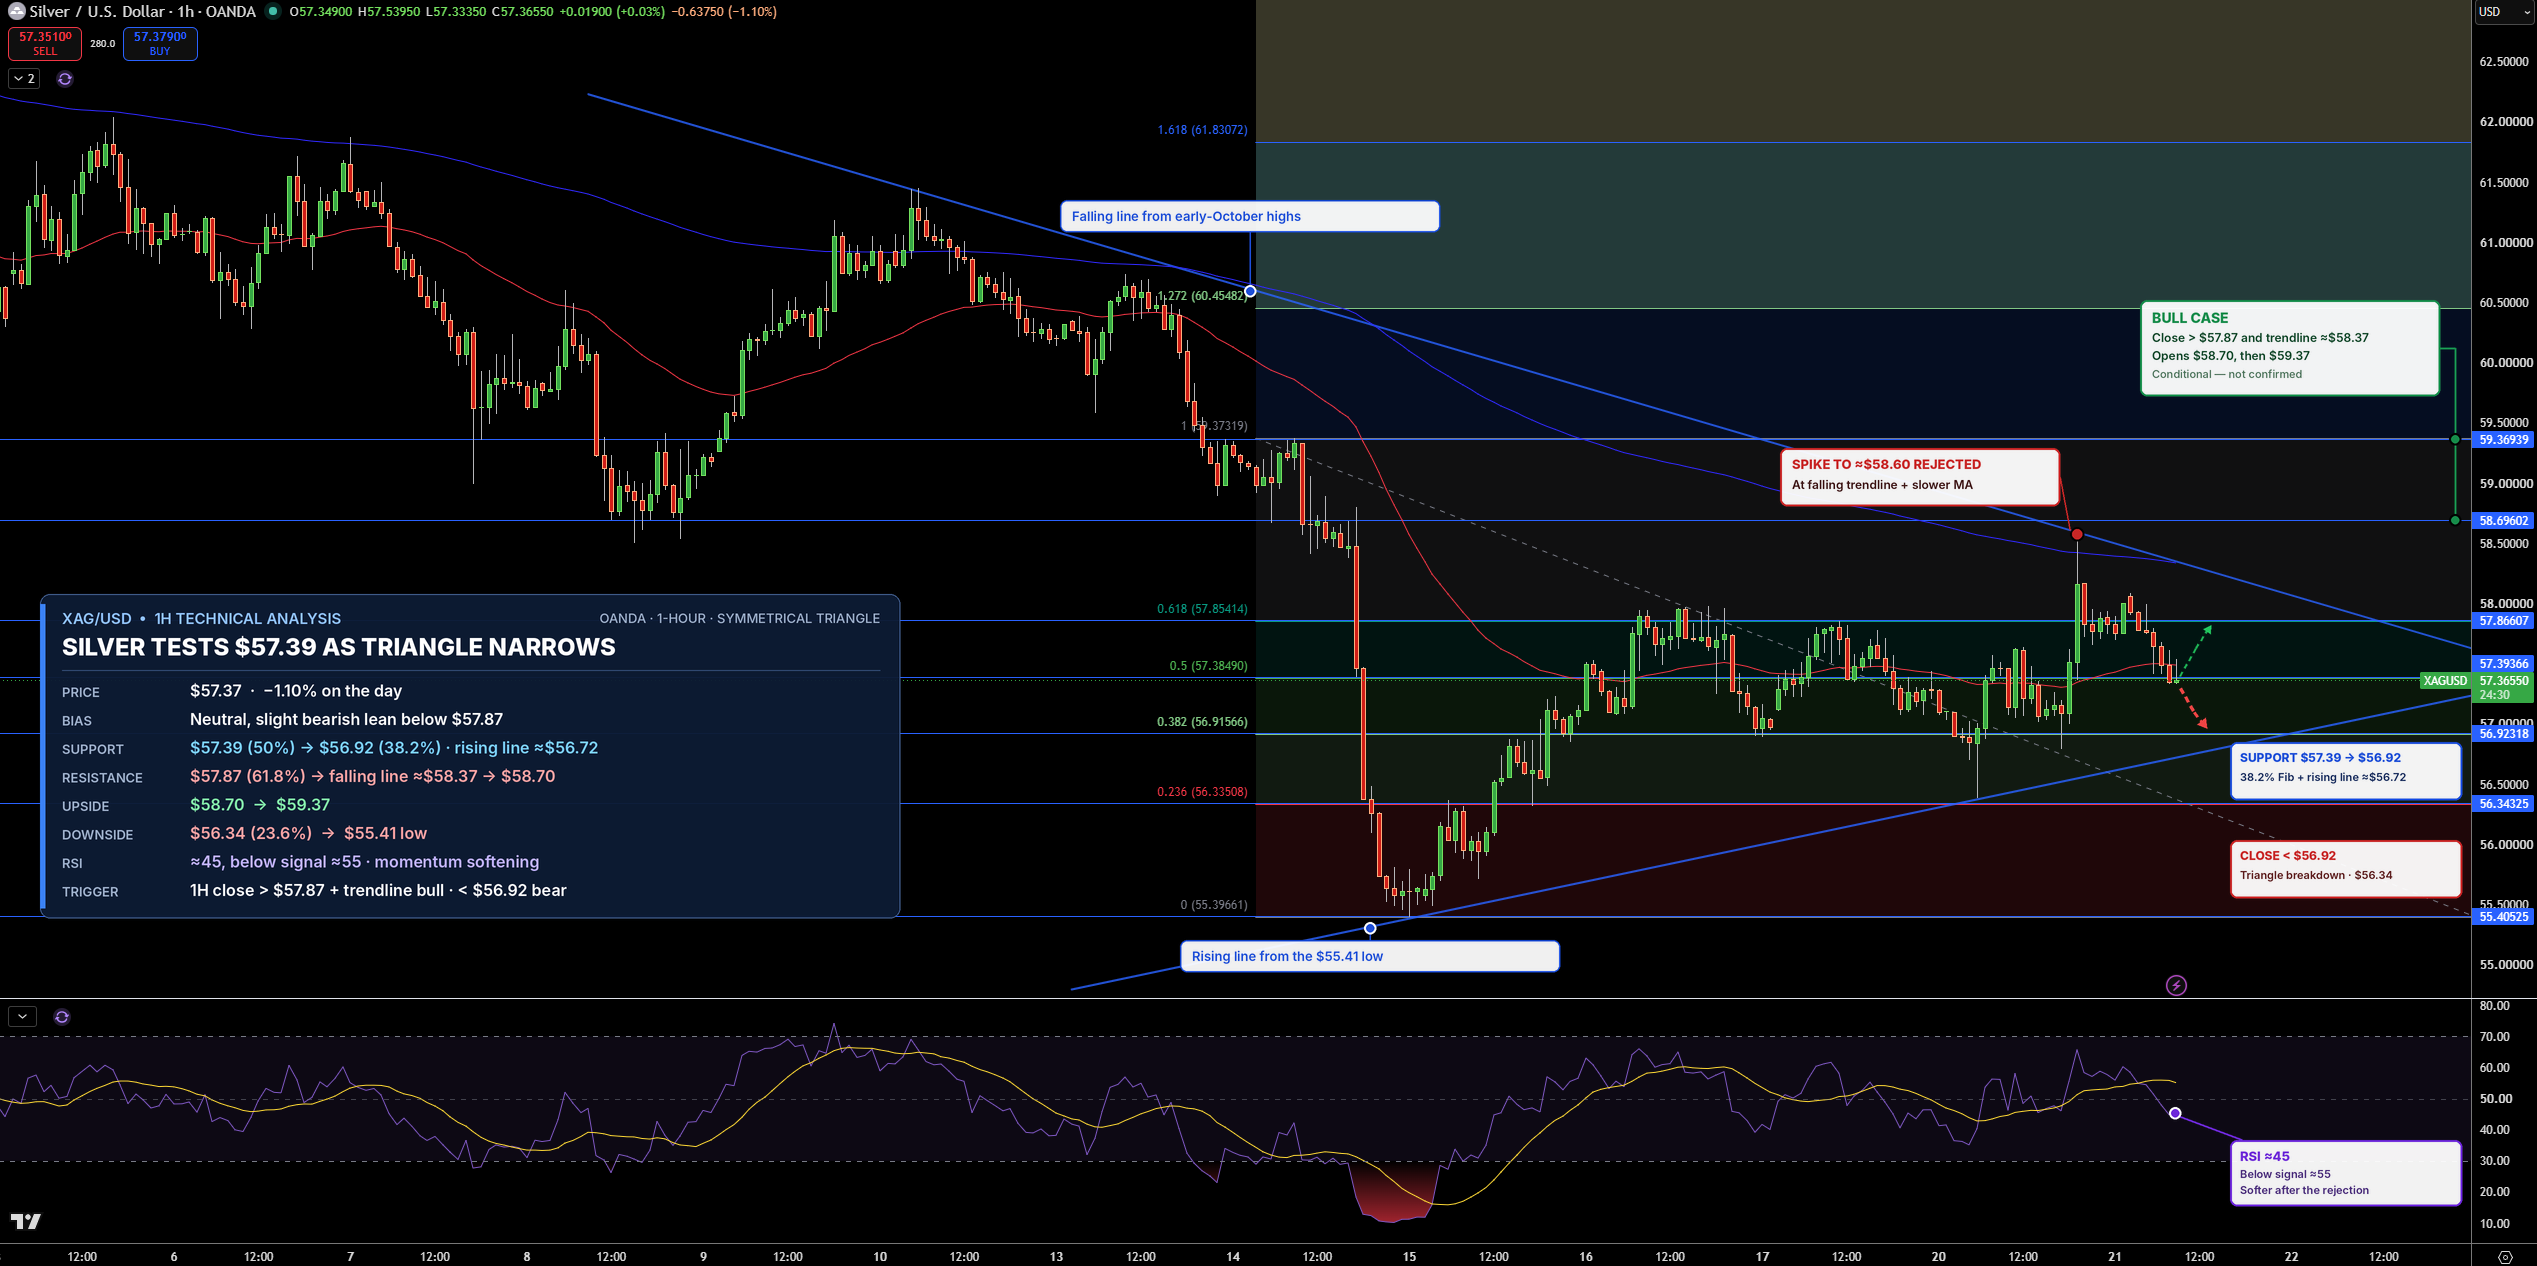
Silver is currently trading at $57.37. What is particularly interesting to me on the 1-hour chart is a triangle pattern. This occurs when price is gradually squeezed into a smaller and smaller range, with a falling trendline above and a rising trendline below that gradually converge. Yesterday’s price action toward $58.65 was pushed away from the upper falling trendline.
The first support area grabbing my attention is at $57.39. The next area is at $56.92, the 38.2% Fibonacci level, with the lower rising trendline just below near $56.72. A break below the trendline would break the pattern and open up $56.34. The resistance area I’m watching is $57.86, followed by the upper falling trendline near $58.37 and then $58.70.
RSI is near 45 and below its signal line, showing softer momentum as the triangle narrows. I am neutral with a slight bearish lean while silver stays below $57.86. A close below $56.92 would put the rising trendline at risk and signal a possible breakdown, while a close above $57.86 and the falling trendline near $58.37 would confirm a bullish breakout.