Nasdaq 100 Technical Analysis
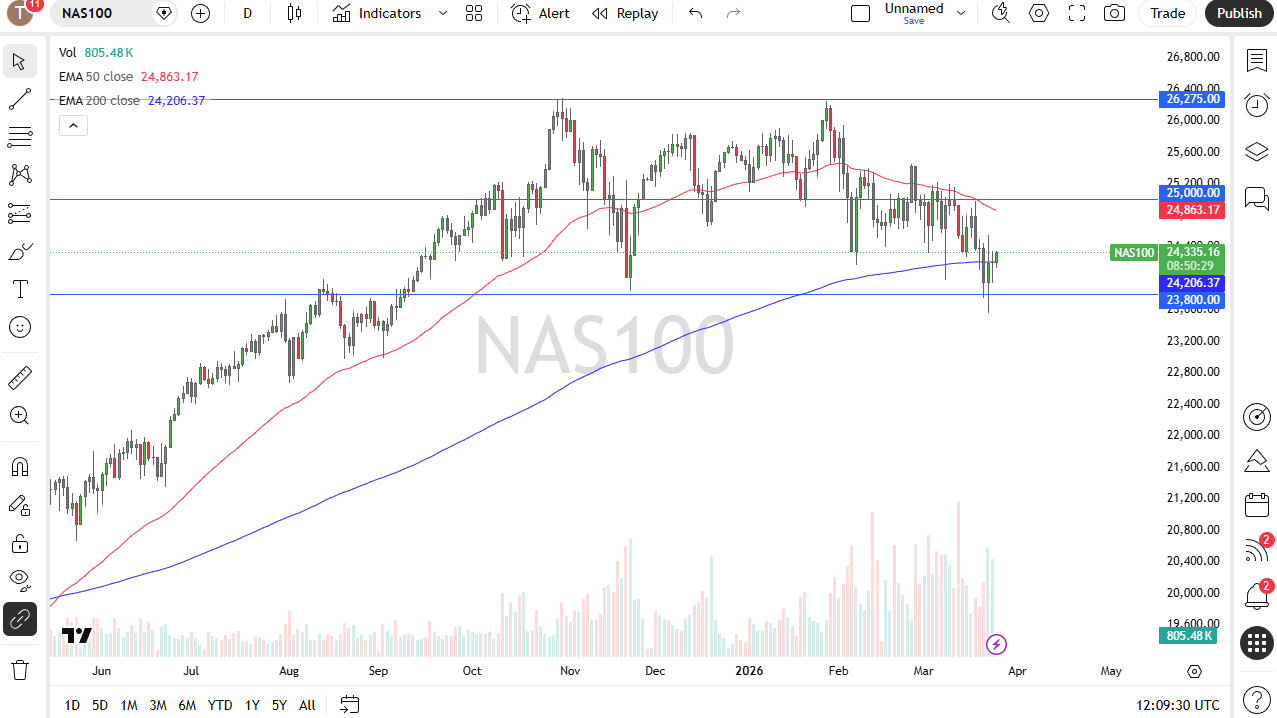
The Nasdaq 100 rose a bit in the early hours of Wednesday as we are now back above the 200-day EMA. The 200-day EMA, of course, is an indicator that most traders will be watching very closely, but I think the most important indicator, quite frankly, is the 10-year yield.
The question is, can it break back below the 4.30% level? If it does that probably unleashes a wave of buying of risk assets. We are currently trading on the idea that the Iranians and the Americans are at least starting the process of talking peace.
That, of course, has the markets happy. It’s a perfect pullback to support and a bounce so far. I am optimistic, but I’m cautiously optimistic, and that’s the key phrase.

Dow Jones 30 Technical Analysis
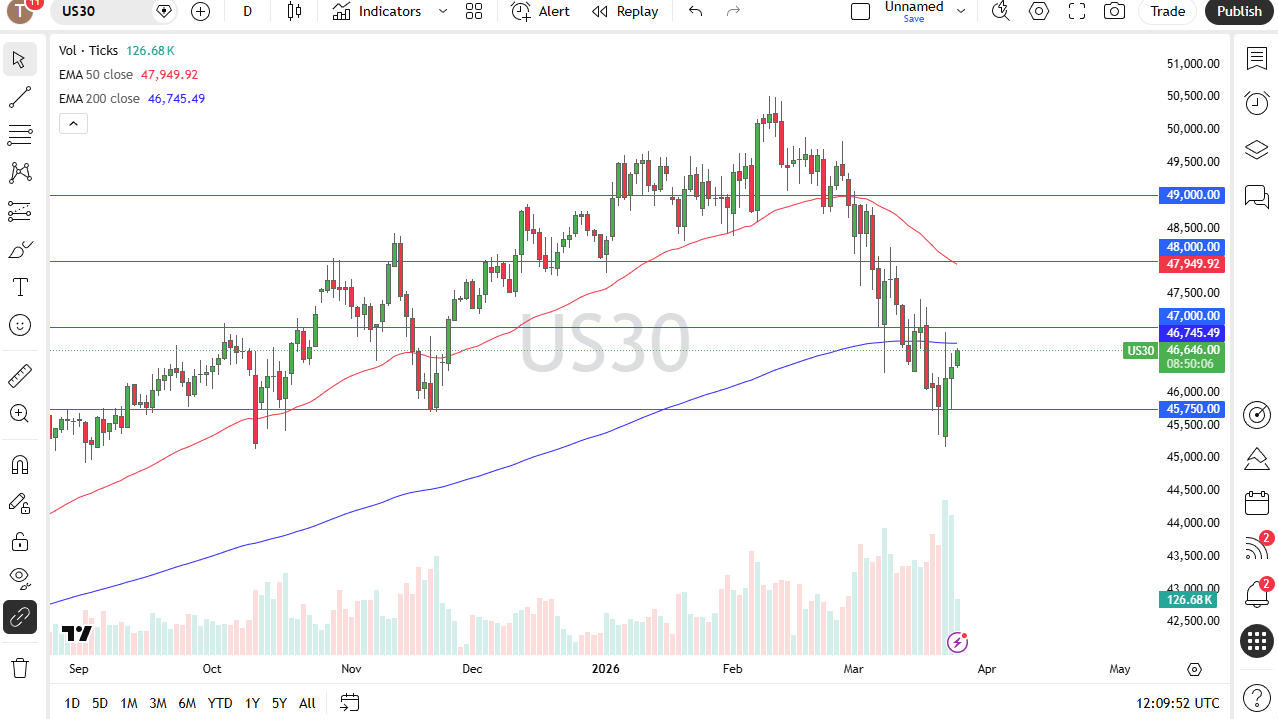
The Dow Jones 30 looks like it is trying to get back to the 200-day EMA and then, by extension, the 47,000 level. If we can break above there, then the market can go looking to the 48,000 level. I think short-term pullbacks continue to be buying opportunities as long as the US and Iran are speaking. This is a market that’s had a pretty significant pullback, but really at this point in time, it’s very healthy, and I think you have a situation where a lot of value hunters are probably stepping in.
NASDAQ 100 Price Forecast
Every new NASDAQ 100 analysis as it publishes, today's technical signal and key levels, live price — on one page.
See all NASDAQ 100 forecastsS&P 500 Technical Analysis
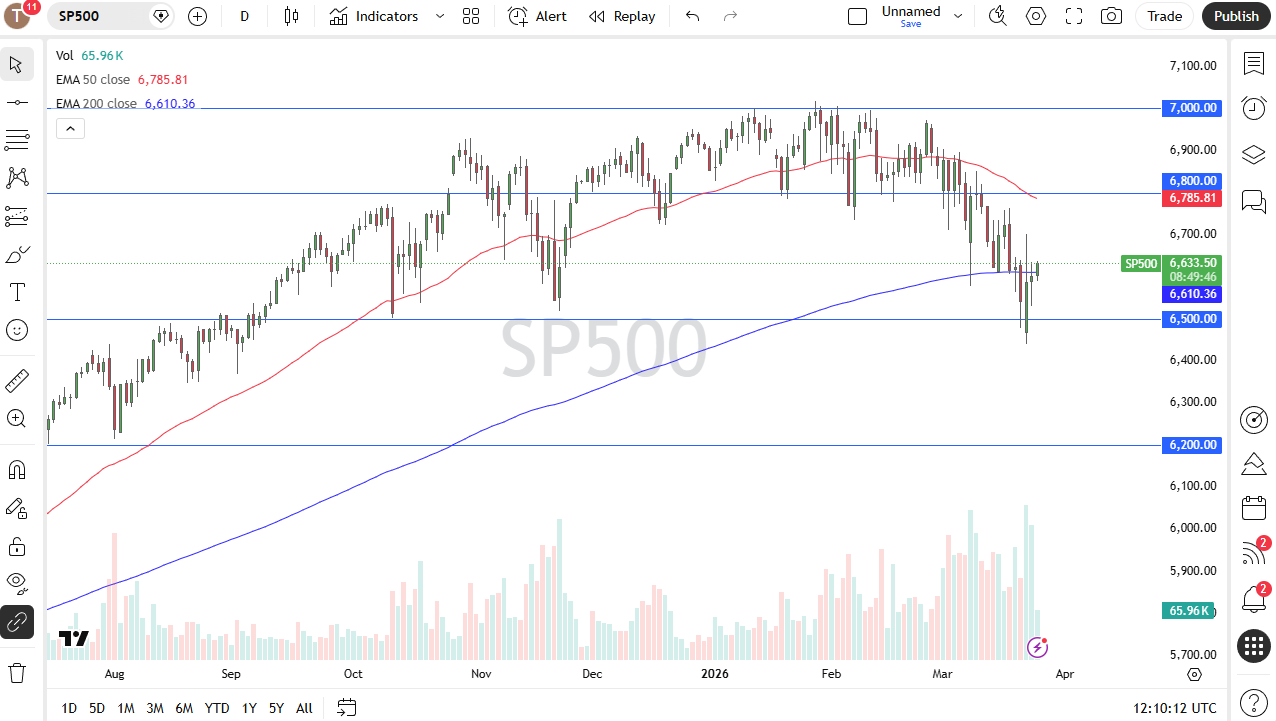
The S&P 500 is back above the 200-day EMA as well, and that, of course, will capture the attention of a lot of traders. So, with that being the case, I think you have to look at this through the prism of a market that eventually wants to recover, and if it does, I could see a move to 6,800 without too many issues. I don’t know if it will be rapid but more of a grind to the upside. So far, the 6,500 region looks to be a major floor in the market, which was a line in the sand from late last year.