
Oil News: Weak Demand Meets Persistent Hormuz Supply Risk
Oil is currently challenging for fundamentals on August 14 as weakening global demand is at odds with volatile supplies out of the Middle East. Crude inventories rose for the first time in six months, reaching their highest level since January of this year asU.S. exports fell. Meanwhile, OPEC reduced its outlook for global demand growth to 2026 by 580,000 barrels per day, where the IEA is more bearish with its view and projects a deeper global demand destruction of 1.6 million barrels per day.
These top-side bearish fundamentals are balancing against continued geopolitical disruptions. With no progress towards resolving diplomacy between the U.S. and Iran, both countries are making claims as to which country has control of the Strait of Hormuz. As of this week, only five ships, excluding container ships, have passed through the Strait. The IEA expects a further dramatic decline of 4.3 million barrels per day for global oil shipments in 2026.
For natural gas, the EIA is more bullish projecting a record 111.2 Bcf/d in dry gas production for 2026, supplemented by an average of 17.4 Bcf/d in LNG exports. More than 3.985 Tcf in storage capacity is expected by the end of October, which would provide a more than comfortable cushion within the U.S.
Tight International LNG supply continues. India’s Petronet reports Qatar has not given any definite plans for September LNG shipments, and force majeure has affected 56 shipments. Buyers replace lost Qatari volumes by sourcing from the United States, Oman, Nigeria, and Angola.
This results in a highly disparate energy mix: declining demand and rising storage in the U.S. exert downward price pressure on crude, while the disruption of Hormuz and a shortage of Qatari LNG create a significant geopolitical premium on supply.

Natural Gas Technical Analysis: NG Rejected Below $2.80 as Momentum Turns Cautious
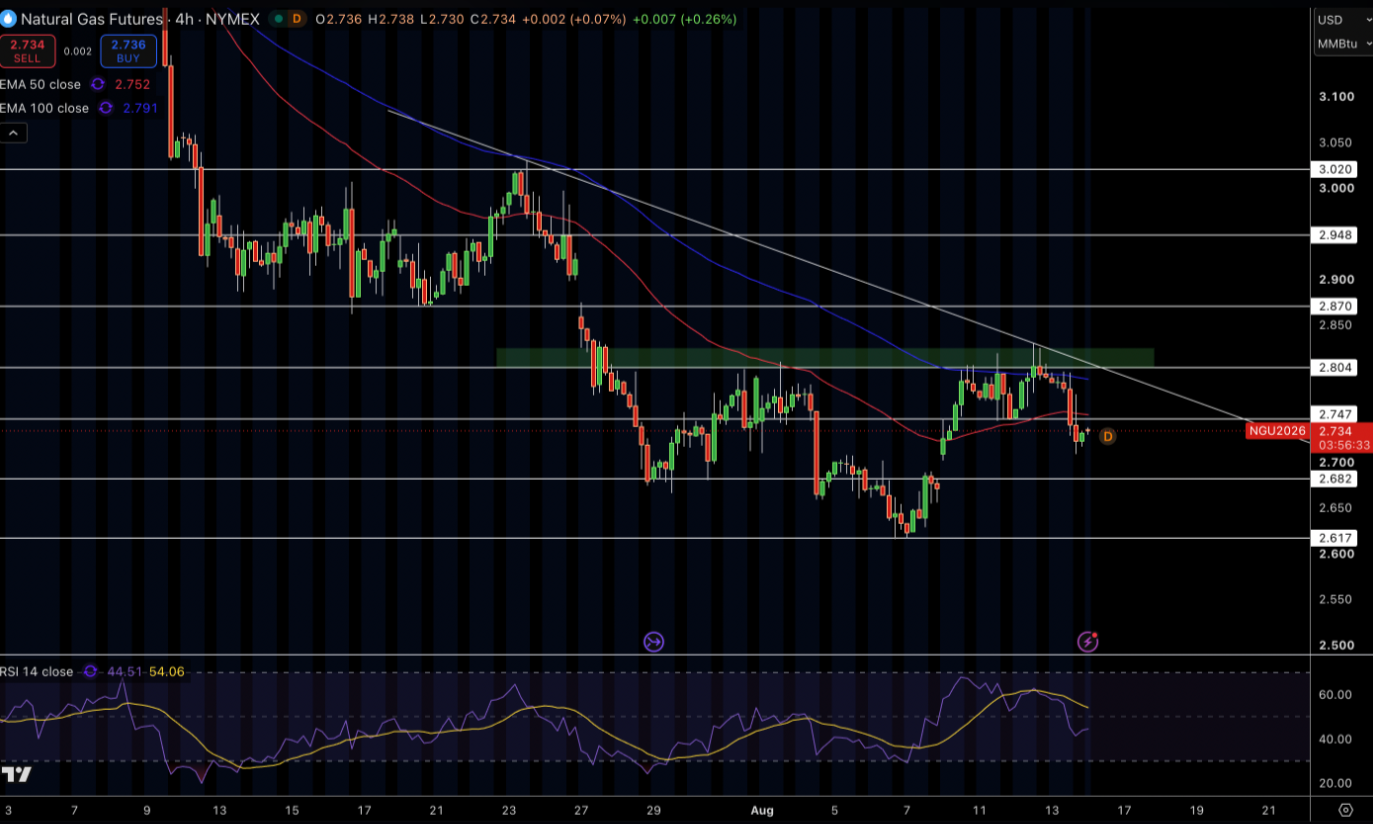
Natural gas is currently priced at around $2.73 on the 4-hour chart following price fall from above the $2.80 area. The trading price is now beneath the 50 EMA priced at around $2.75 and the 100 EMA at around $2.79. As a result, the trading environment is in a state of pressure as the pair continues to trade beneath the descending trend line and the latest price action has confirmed the continuation of the dominating selling pressure.
RSI at 45 confirms a lack of momentum to the downside, however, is not oversold. Resistances are located at $2.75, $2.80 and $2.87. Supports are located at $2.68, $2.62, and $2.55. In my opinion, the price of natural gas trading below $2.80 shows that the overall outlook for the price of natural gas is bearish. Natural gas price trading below the EMA cluster and above the descending trend line shows that a price retest at $2.68 levels may be imminent.
Natural Gas Price Forecast
Every new Natural Gas analysis as it publishes, today's technical signal and key levels, live price — on one page.
See all Natural Gas forecastsWTI Crude Oil Technical Analysis: $81.60 Support Keeps Recovery Structure Alive
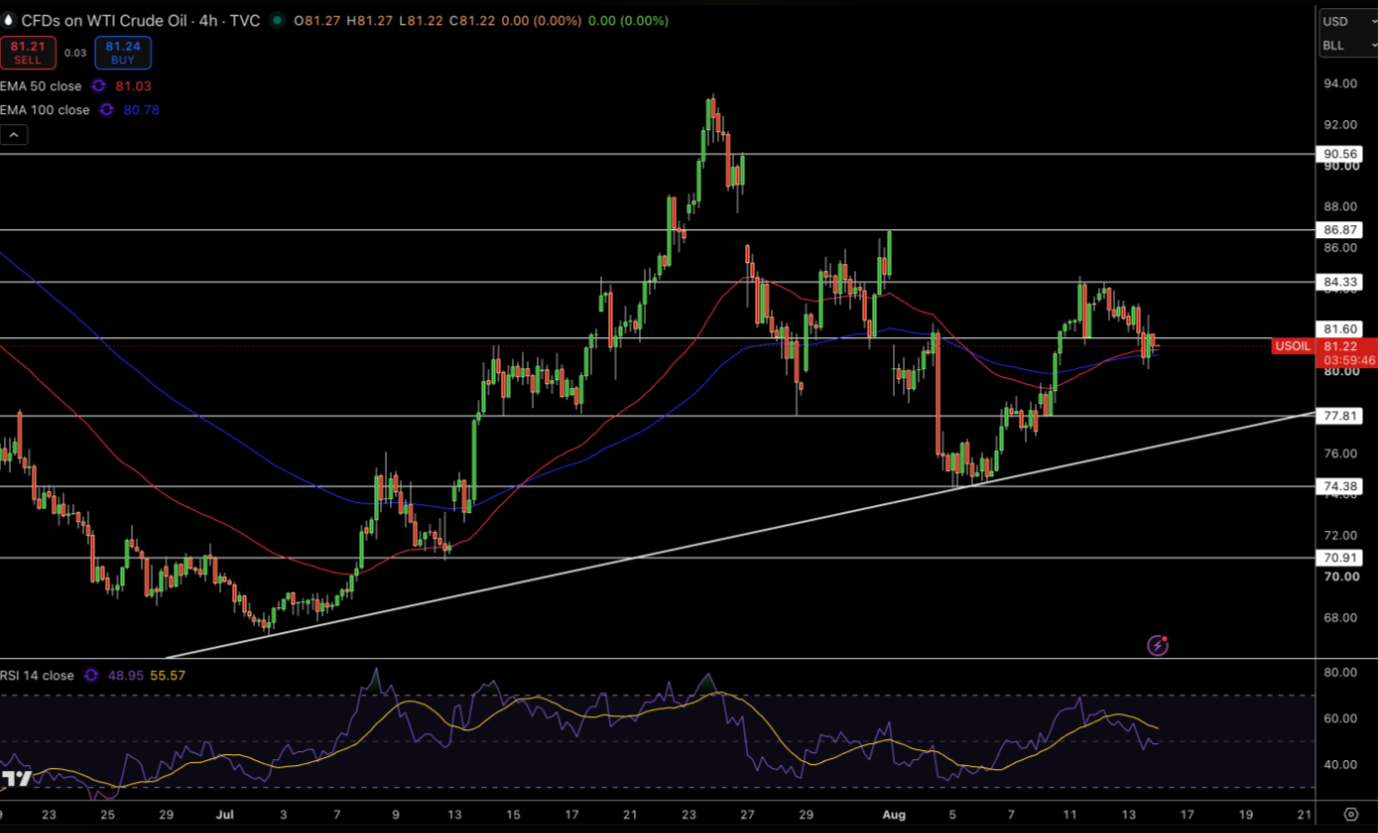
Crude is currently valued at $81.22 and rests on $81.60 support area with both moving averages in close proximity on the 4-hour chart. With the 50 EMA at $81.03 and $80.78 100 EMA slightly below the price, we are looking at an extremely important decision zone. The $84.33 area pullback has affected the short-term momentum. However, as long as price rests above the moving average zone and the rising trendline, the broader recovery of $74.38 is intact.
With RSI at 49, we are looking at neutral momentum after the recent sell-off. Immediate resistance is set at $84.33, with $86.87 and $90.56 as the next resistance levels. $81.00 – $81.60 is the first support zone, followed by $77.81 and $74.38. I believe that holding the moving average zone can assist in sideways consolidation toward the $84.33 level. A break below $80.78 would weaken the recovery and increase the likelihood of a move to $77.81.
Brent Crude Oil Technical Analysis: Brent Pulls Back Toward $86.67 Breakout Support
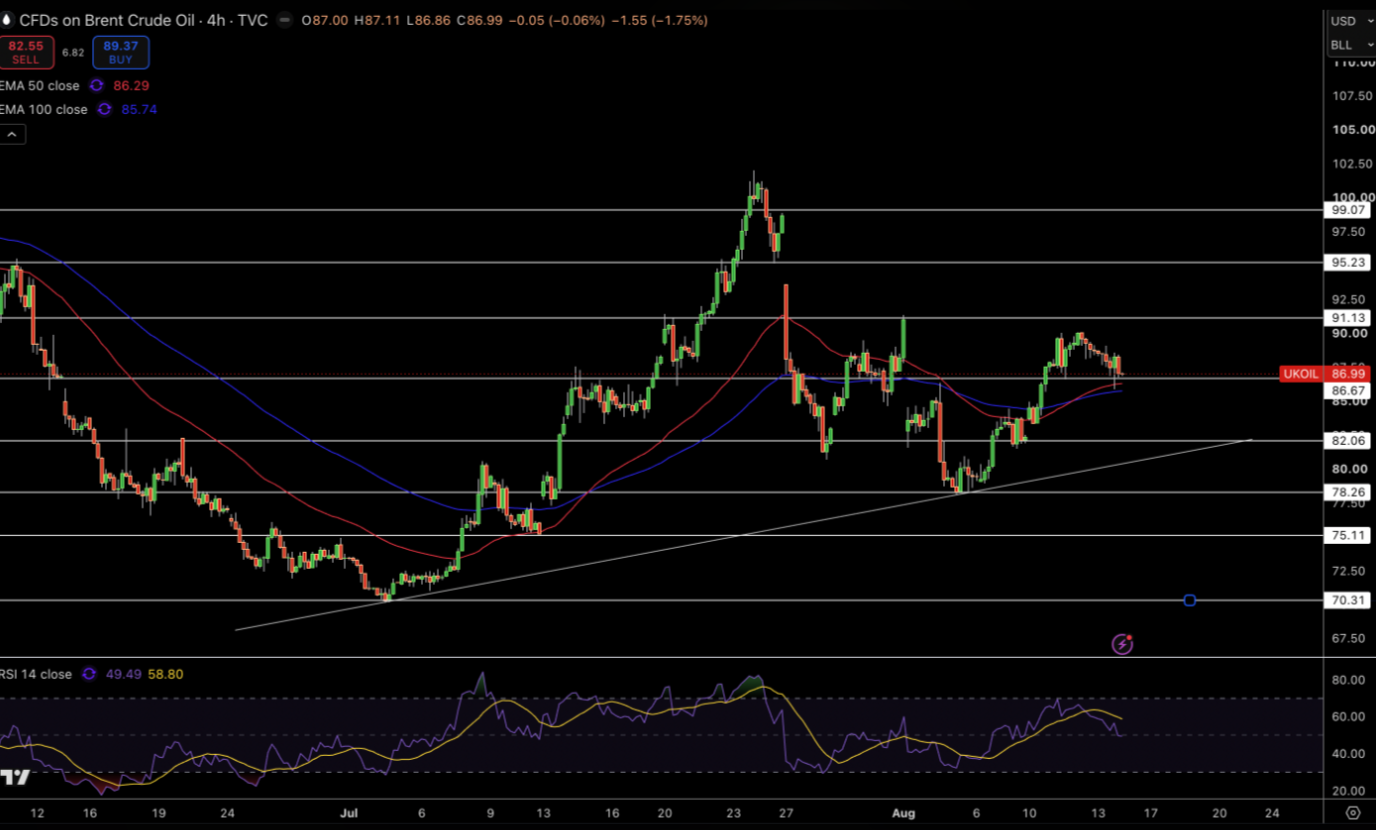
Brent is currently trading at $86.99 on the 4-hour chart after losing momentum while trading at $89-$90. Price is currently wedged between the 50 EMA at $86.29 and the 100 EMA at $85.74, showing an overall bullish bias. A break of the channel top at $90 also managed to establish a new level of support below the recent decline, though, it is worth noting that current price action is testing the support level at $86.67, the previous resistance level.
Current momentum is also slowing and RSI is now reading at 49. Price should not fall too far and should find support first at the EMAs ($85.74-$86.29) before falling toward $82. However, if Brent is able to cross below $85.74-$86.67, which is currently acting as support, then I believe we could see a larger downside move toward $82.06.