NASDAQ 100 Technical Analysis
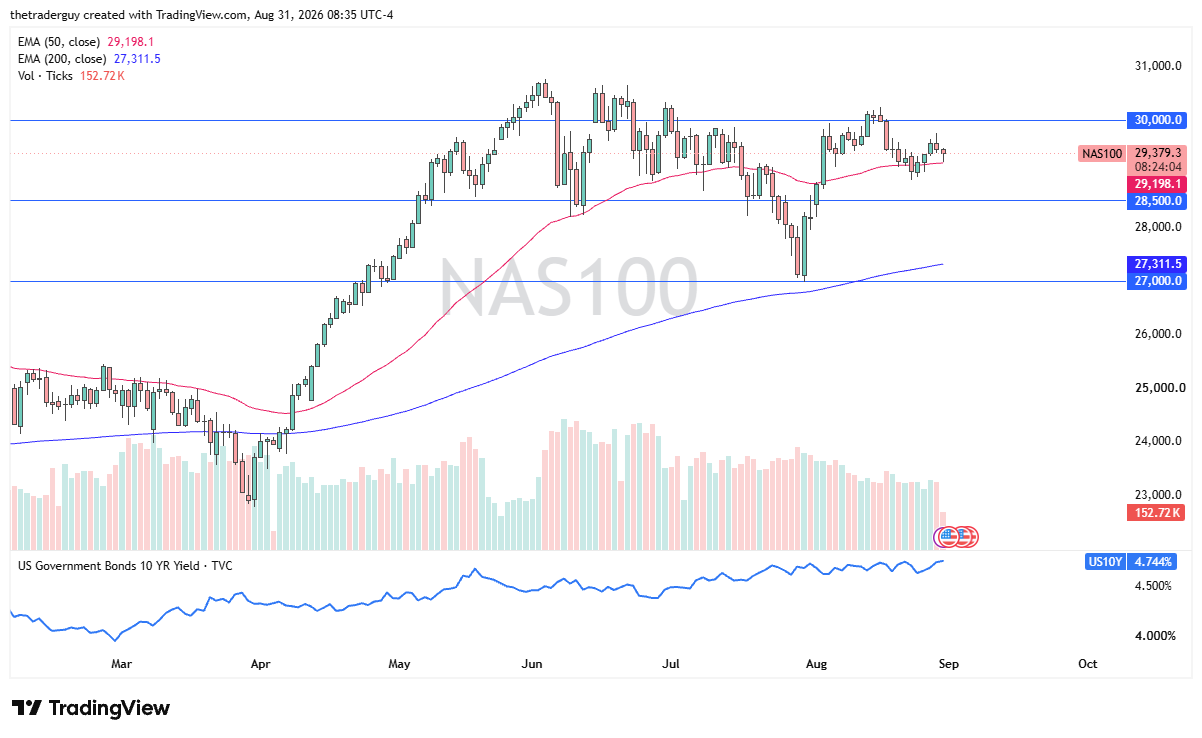
The Nasdaq 100 is a bit negative in pre-market trading on Monday, but it has bounced from the 50-day EMA, so we’ll have to wait and see to find out whether or not there is a certain amount of resiliency to this market.
Traders continue to look at this market as one that is battling high interest rates, but seems to be fairly resilient. Nvidia earnings helped a couple of days ago, so that’s something worth keeping in mind.
Kevin Warsh on Friday suggested that interest rate cuts aren’t coming anytime soon, but he also commented on the resiliency of the US economy, and that’s something that’s probably not lost on traders here.

Dow Jones 30 Technical Analysis
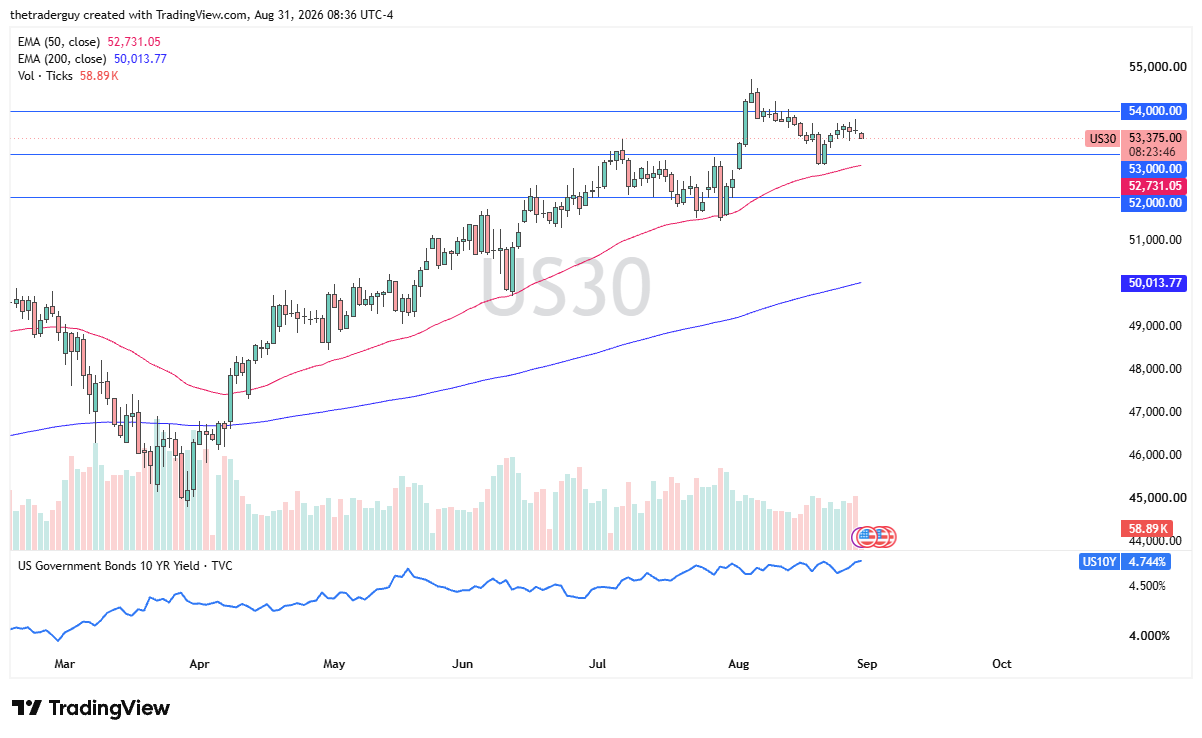
The Dow Jones 30 looks a bit soft at the moment, but still has a major support level underneath current trading near the 53,000 level, especially now that the 50-day EMA is racing towards that level as well.
To the upside, the 54,000 level continues to be a bit of a barrier, and it would be a target for bulls if they show up.
This is a market that has been very choppy and noisy, but it is the last day of the month, so there might be some position squaring late in the day that could skew price action.
S&P 500 Technical Analysis
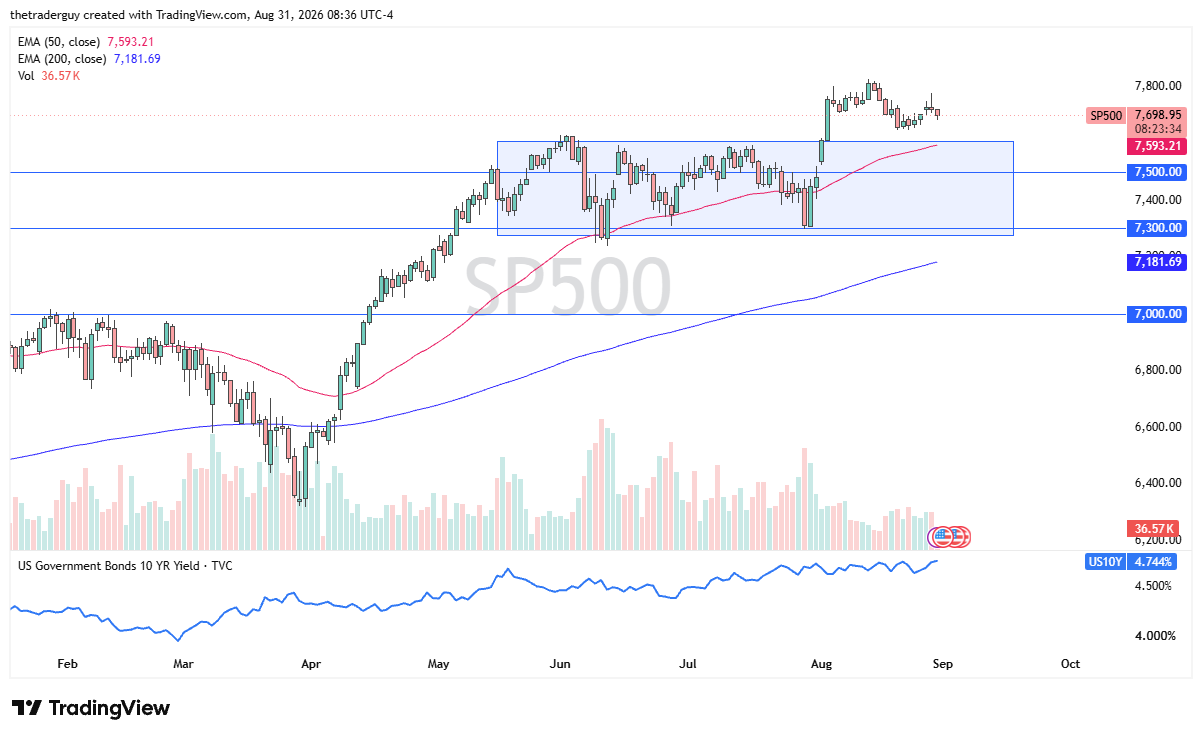
The S&P 500 looks a bit negative in pre-market trading. And again, end of the month price action could cause some chaos here on the very end of the day.
S&P 500 Price Forecast
Every new S&P 500 analysis as it publishes, today's technical signal and key levels, live price — on one page.
See all S&P 500 forecastsBut really, at this point, it’s still a bullish-looking chart. It’s now a chart that looks like it’s just working off some excess froth. It doesn’t look bad considering everything that people had been banking on- lower interest rates- are not coming, but we’re still elevated.
So, it’s at least a resilient-looking chart in the face of high interest rates, and that in and of itself might be something worth considering.
If you’d like to know more about chart patterns and how to trade them, please visit our educational area.