
Key Insights

- Netflix’s strong Q4 report boosts U.S. futures; Tesla’s awaited earnings highlight EV competition.
- S&P 500 (SPX) trends bullish, potentially challenging resistance levels at $4,907.21 and above.
- Dow Jones (DOW) eyes further gains, trading above pivot point with bullish indicators.
U.S. Futures Climb as Netflix Surges, Tesla Earnings Awaited
U.S. stock futures rose on Wednesday, propelled by Netflix’s robust quarterly results, signaling a vibrant earnings season. Netflix’s report, showing a significant increase in subscribers and revenue, positively impacted market sentiment.
The streaming giant added 13.12 million users in the fourth quarter, surpassing estimates with a 71% year-over-year increase and revenue growth of about 12% to $8.83 billion.
Attention now turns to Tesla’s upcoming report, anticipated to forecast a 21% rise in yearly deliveries, below CEO Elon Musk’s long-term target, highlighting Tesla’s growing competition in the EV sector.
Key economic data, including U.S. PMI figures will also influence market trends.
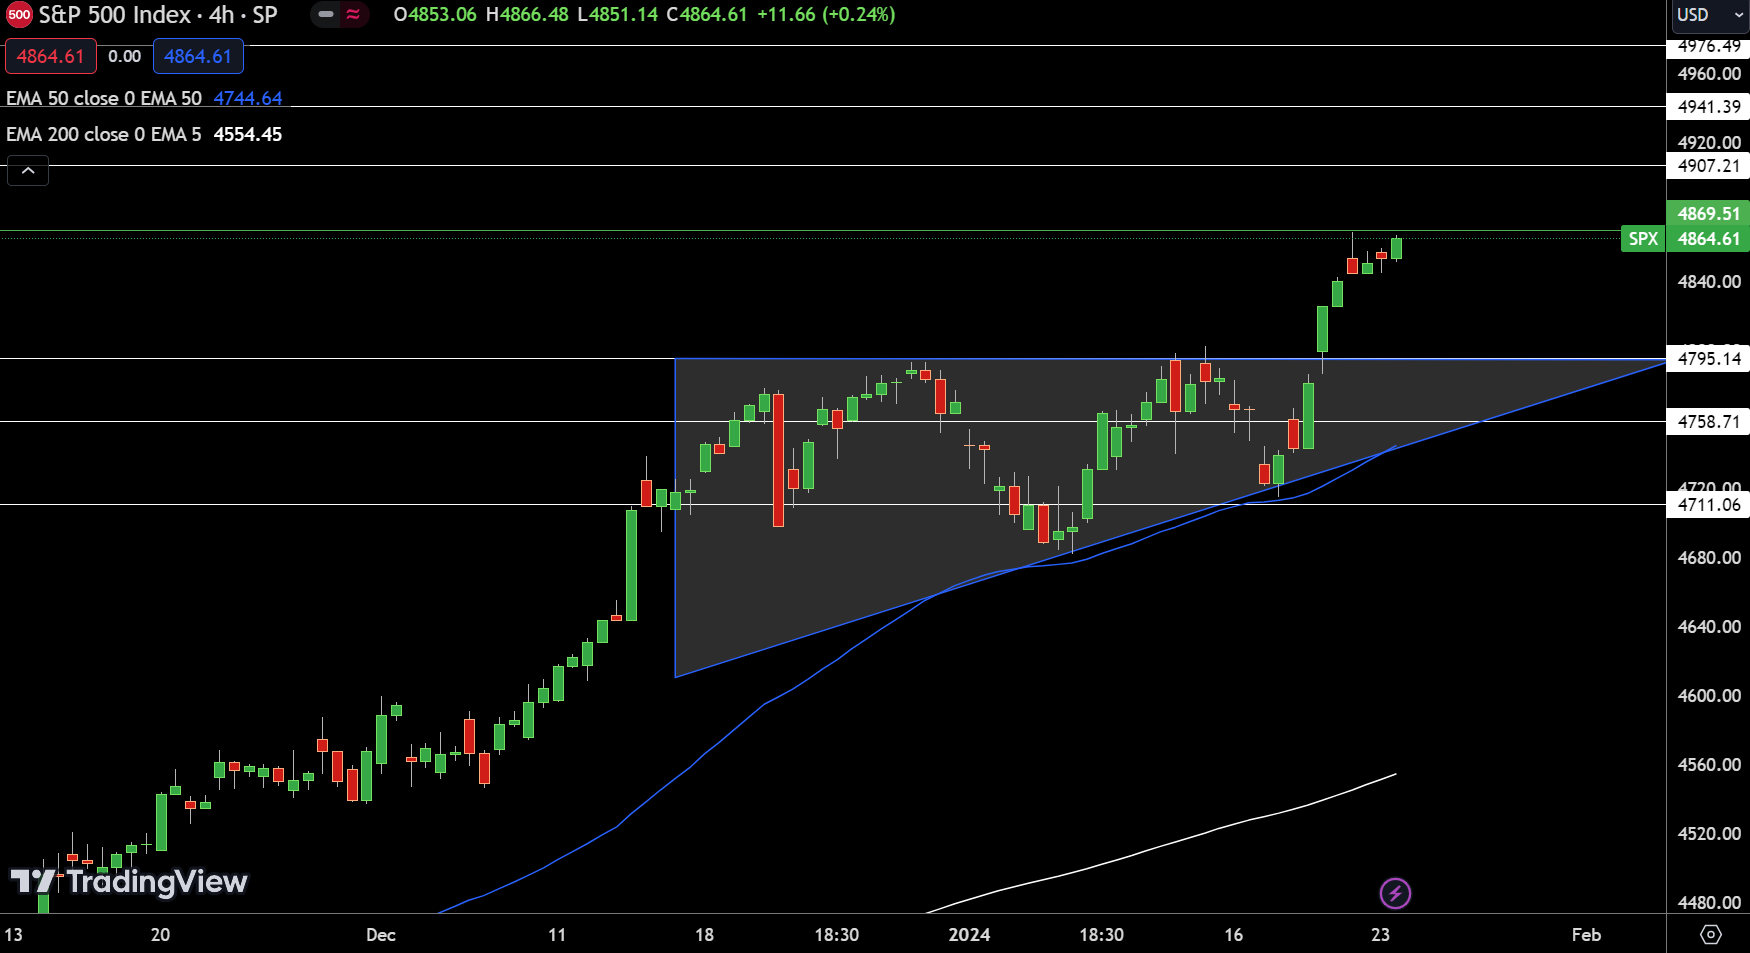
The overall trend remains bullish above $4845, indicating a potential for further testing of resistance levels in the short term.
Dow Price Forecast
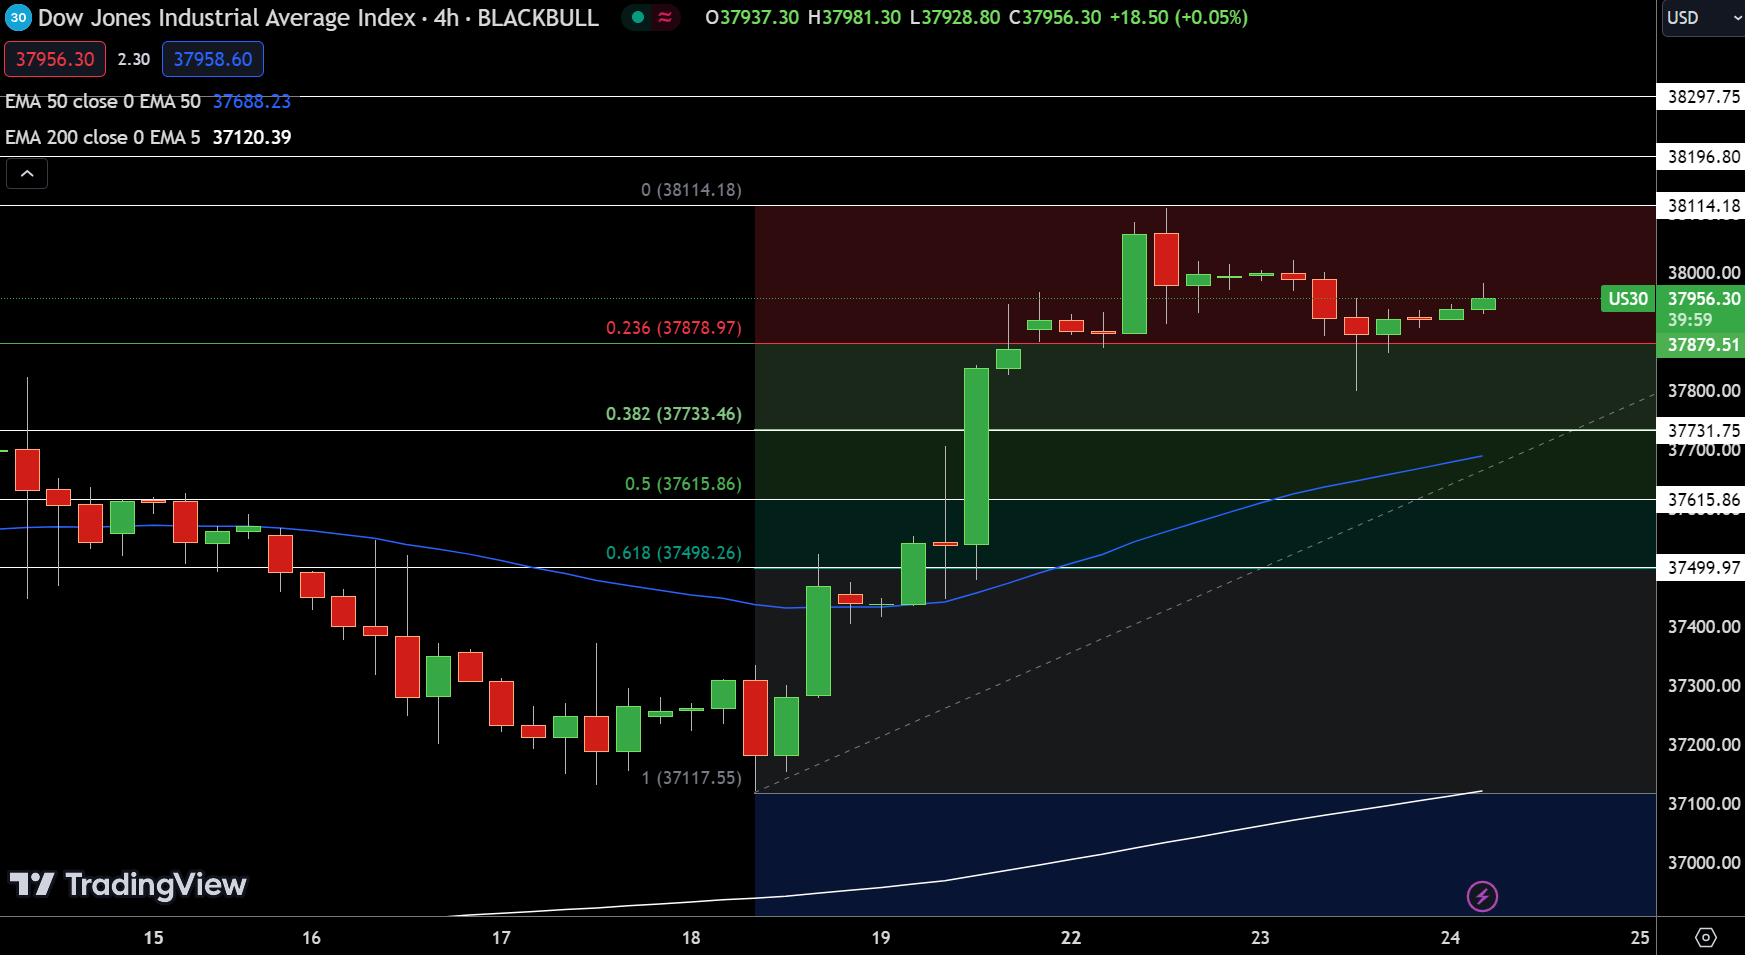
The Dow Jones Industrial Average (DOW) is showing a modest increase, currently trading at $37956.30, up by 0.08%. Its technical landscape revolves around a pivot point at $37,956.30. Immediate resistance levels are seen at $38,114.18, $38,196.80, and $38,297.75.
On the downside, support is found at $37,731.75, with further levels at $37,615.86 and $37,499.97.The 50-Day and 200-Day Exponential Moving Averages, positioned at $37,688.23 and $37,120.39 respectively, add to the technical analysis.
A significant chart pattern observed in the Dow is the completion of a 23.6% Fibonacci retracement at $37,878.97. The formation of Hammer and Doji candlesticks around this level suggests a potential for an uptrend. Conclusively, the Dow exhibits a bullish trend above the $37,878.97 mark.
NASDAQ Price Forecast
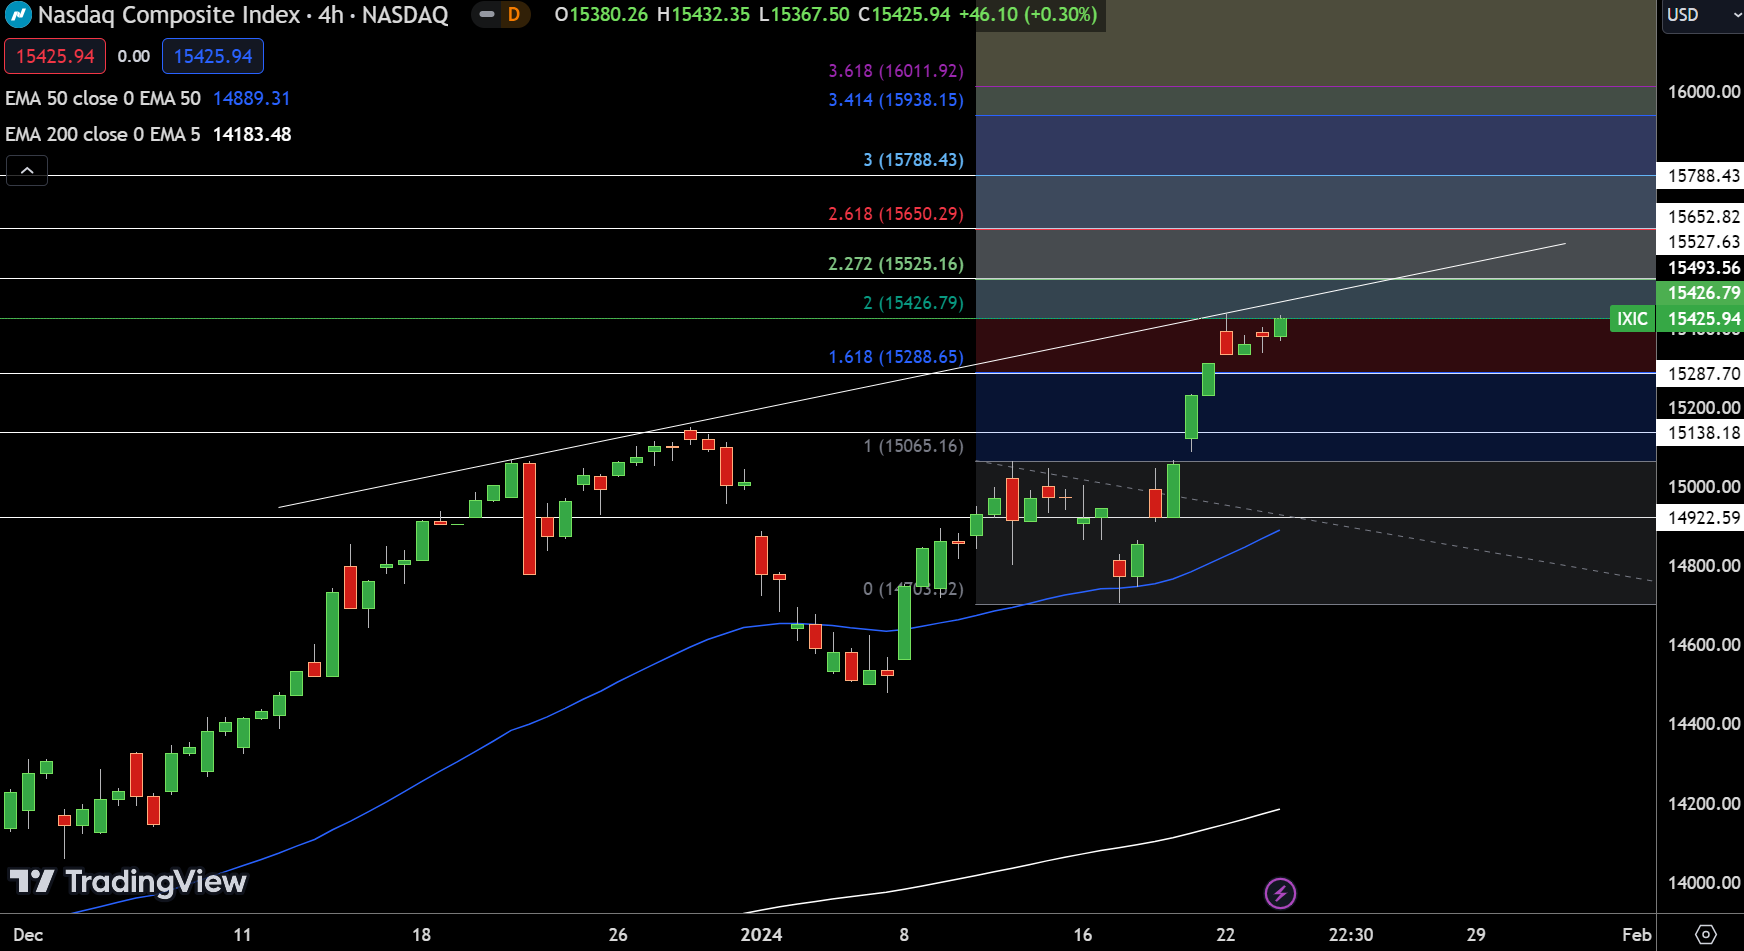
The NASDAQ index’s pivot point is established at $15,426.79 and it confronts immediate resistance at $15,527.63, with subsequent hurdles at $15,652.82 and $15,788.43. These levels will be decisive in determining the index’s short-term trajectory.
On the support side, the NASDAQ finds its first line of defense at $15,287.70. Further support levels are marked at $15,138.18 and $14,922.59, which could provide a cushion against potential declines. The 50-Day and 200-Day Exponential Moving Averages, at $14,889.31 and $14,183.48 respectively, underpin the current trend.
The NASDAQ’s path is steering towards the 227.2% Fibonacci extension level near the $15,525 mark, a significant technical indicator of bullish momentum. In summary, the NASDAQ exhibits a bullish stance above the pivot point of $15,426.