
Key Insights
- Unemployment claims fall to 187K; Building Permits at 1.50M, signaling robust U.S. economic health.
- Tech sector’s surge led by Taiwan Semiconductor, boosts NASDAQ, SP500, and Dow Jones forecasts.
- Apple’s shares jumped 1.6% following an optimistic upgrade from BofA.
Quick Fundamental Outlook
As the US indices gear up for a positive shift, the latest data shows Unemployment Claims dropping to 187K, significantly below the forecast of 203K, reflecting a robust labor market. Concurrently, Building Permits have risen to 1.50M, surpassing expectations and indicating a healthy construction sector.
This economic backdrop sets the stage for a surge in tech stocks, with U.S.-listed Taiwan Semiconductor leading the charge, soaring 5.5% on the back of a predicted 20% revenue growth in 2024, driven by strong demand for advanced chips.
Alongside, stocks like Nvidia, Microchip Technology, Marvell Technology, and AMD are witnessing increases between 1.6% and 3.2%. Mega-cap stocks such as Microsoft, Tesla, and Meta Platforms are also on the rise.

Apple’s shares jumped 1.6% following an optimistic upgrade from BofA. This collective momentum in technology equities is expected to underpin the NASDAQ Index, SP500, and Dow Jones, painting a bullish outlook for these indices.
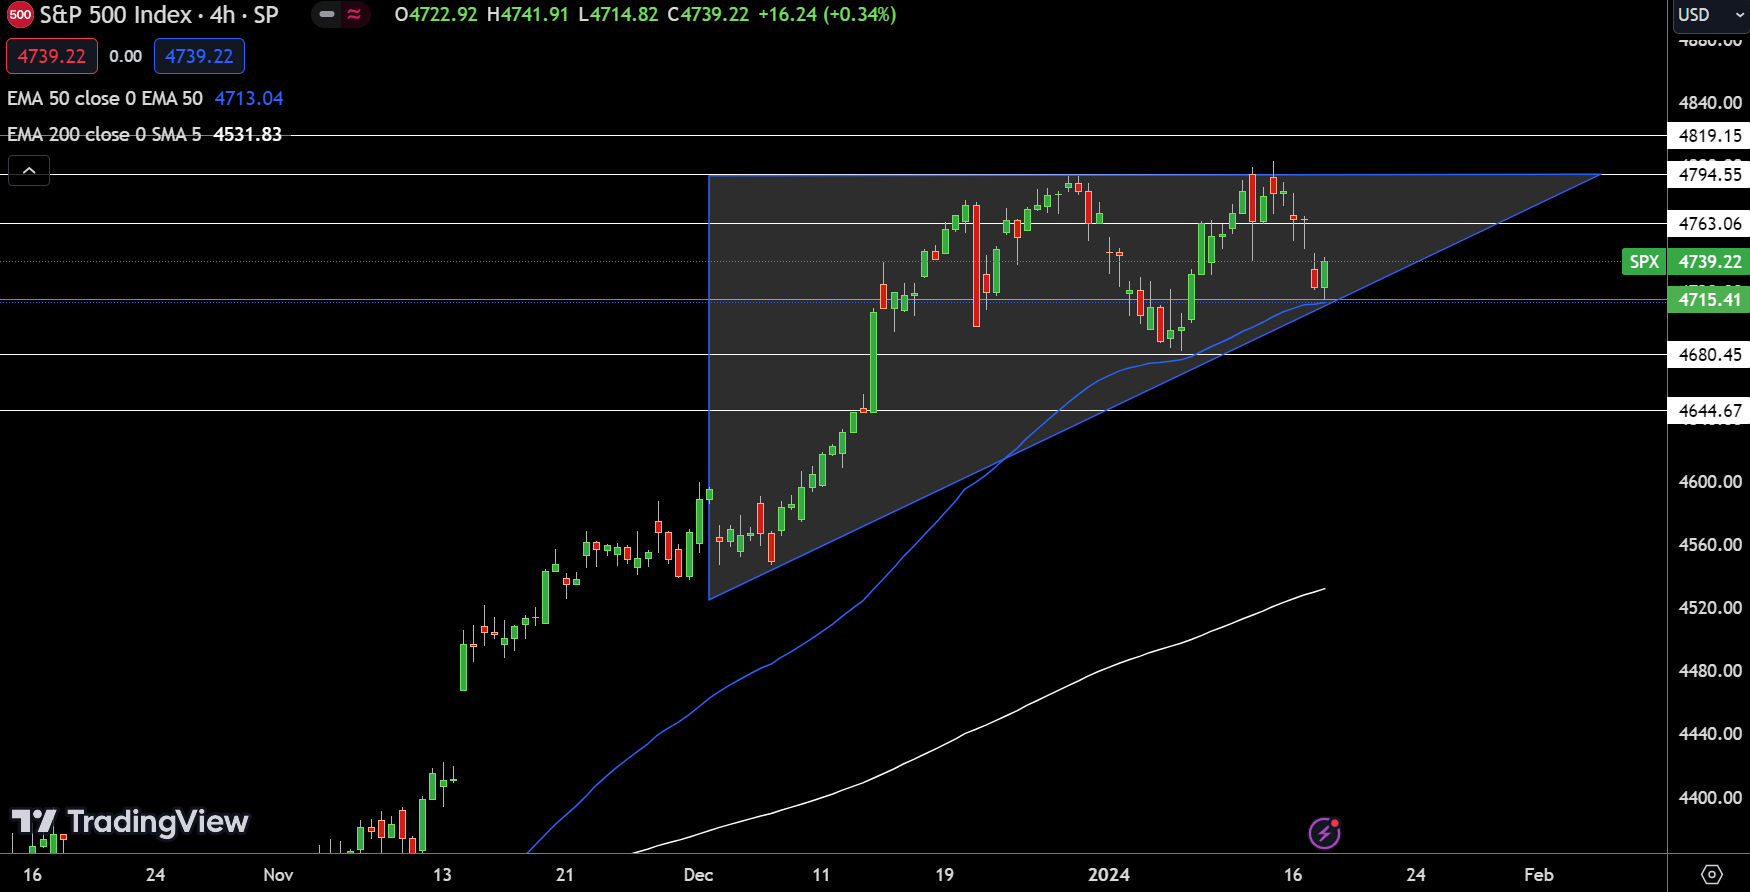
SPX continues to trade within an ascending triangle pattern, displaying resistance at $4794.55 and support around the $4715.41 level, where the 50 EMA converges, indicating a possible buying zone above this level. The overall trend for SPX is bullish above the $4715.41 mark.
Dow Price Forecast
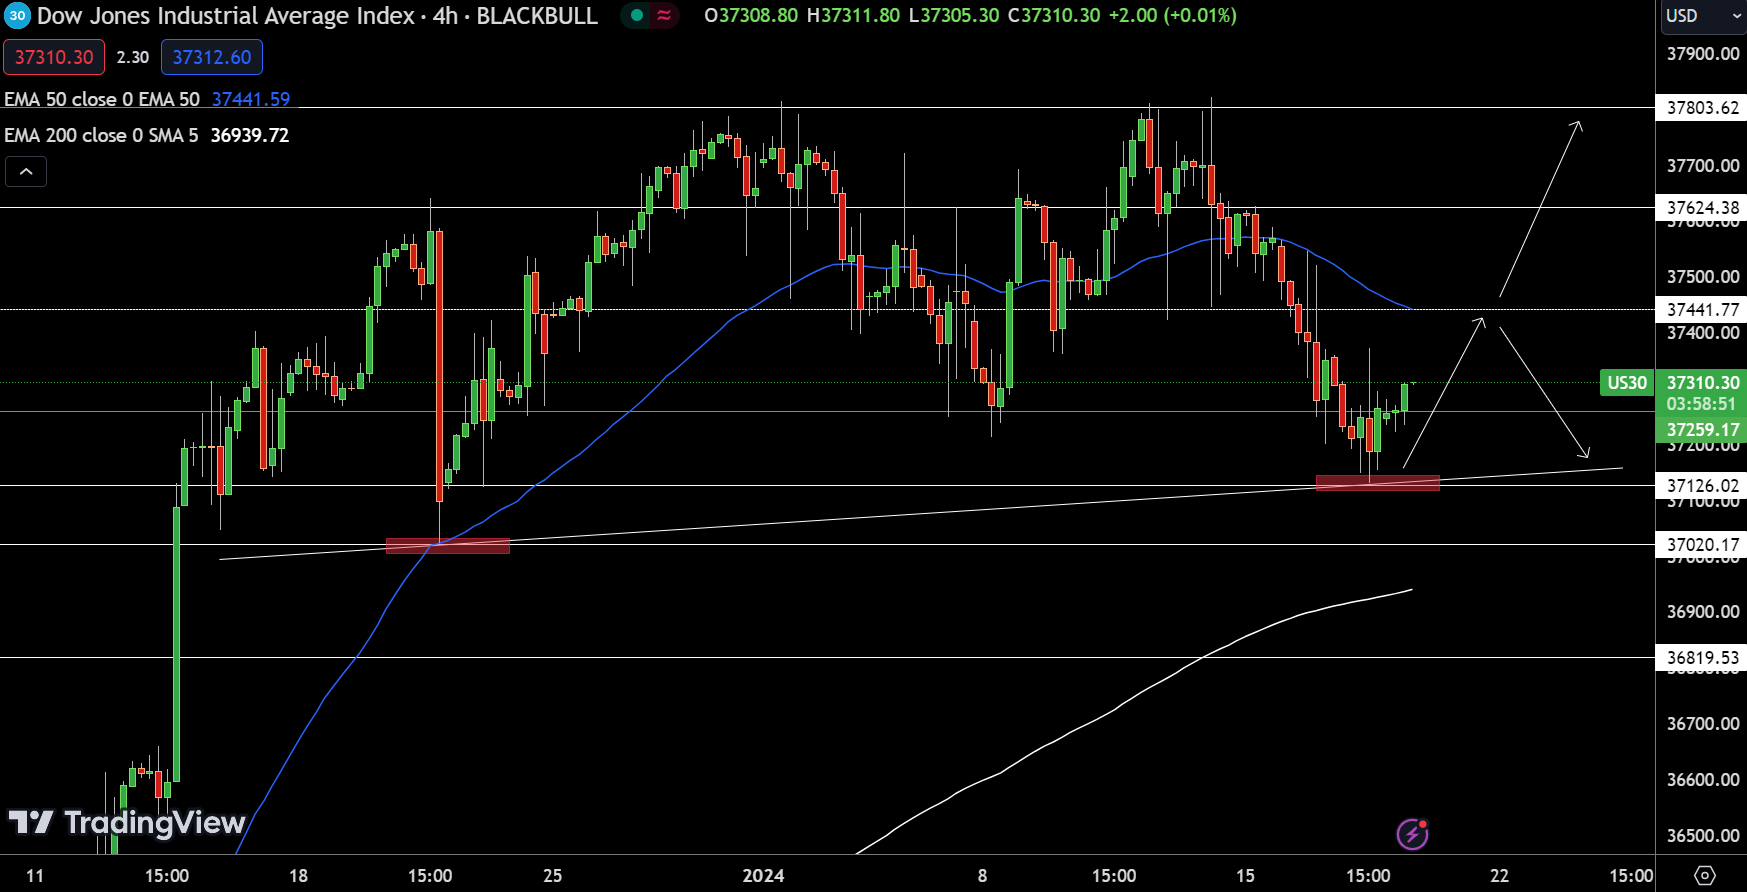
A key observation is the upward trendline that has been prompting buying around the $37126.02 level. The formation of a bullish engulfing candle pattern also supports this buying trend, indicating a growing bullish momentum. The overall trend for the Dow Jones is bullish above the $37259.17 mark.
NASDAQ Price Forecast
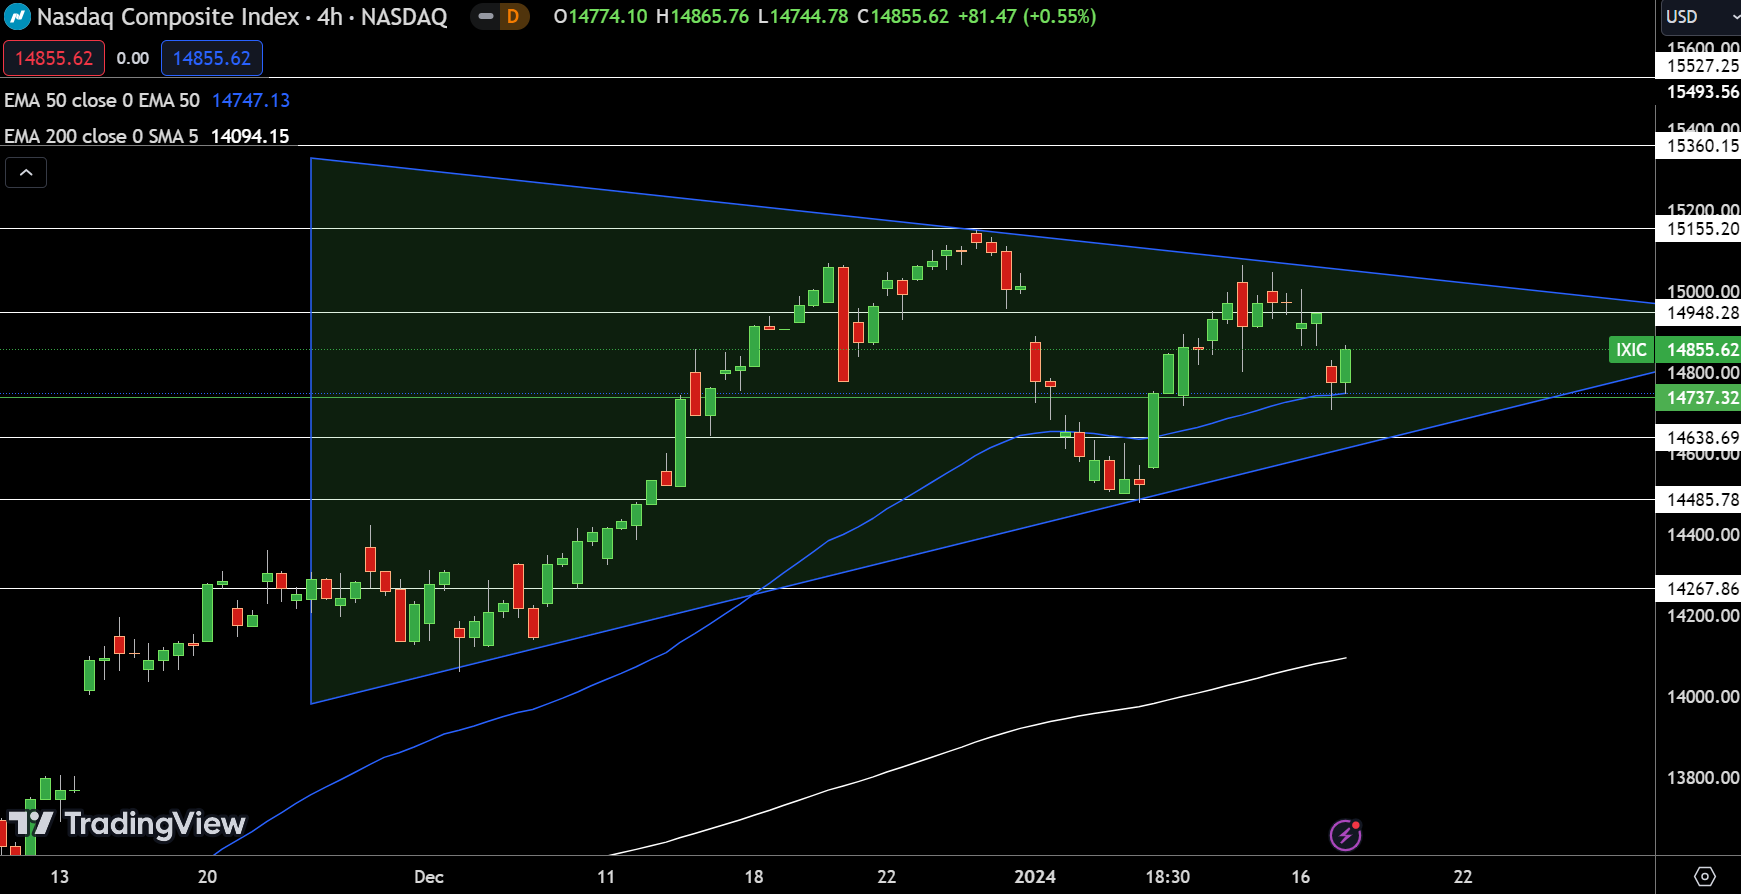
On January 18, the NASDAQ Composite Index’s 4-hour chart presents a pivot point at $14,737.32. The index faces immediate resistance levels at $14,948.28, $15,155.20, and $15,360.15. Support levels are identified at $14,638.69, $14,485.78, and $14,267.86.
The Relative Strength Index (RSI) stands at 53, indicating a neutral to slightly bullish market sentiment. Technical indicators highlight the 50-Day Exponential Moving Average (EMA) at $14,747.13 and the 200-Day EMA at $14,094.15, both potentially impacting the index’s trajectory.
A symmetrical triangle pattern is observed, suggesting a consolidation phase. The 50 EMA provides support around $14,747.13, which could play a pivotal role in the index’s short-term movement. Overall, the trend for the NASDAQ is bullish above the $14,737.32 level.
For a look at all of today’s economic events, check out our economic calendar.