
Oil News: Hormuz Standoff Tests Recovering OPEC Supply
Oil fundamentals continue to be primarily dominated by the Middle East as hopes for a U.S.-Iran agreement have dimmed. Constant delays and a severe lack of shipping through the Strait of Hormuz continue to be an issue. Only 6 ships were recorded transiting Hormuz on Monday compared to the 10-day average of 11 and a volume of 130-140 ships a day prior to the conflict. Saudi Aramco has delayed the restarting of the Jazan refinery following the Houthi attacks, while ADNOC has opted to continue using tenders with other methods of supply to offset the gaps.
Recovery in supply has begun. According to a Reuters survey published on August 10, OPEC has increased its output by 1.17 million barrels per day in July, with the new total standing at 19.85 million barrels per day, and led by Kuwait and Iraq as Gulf producers restored their output post-war. Output however, has been significantly below quotas. Separately, OPEC+ has approved an increase in production of 188,000 barrels per day for September, completing the scheduled unwinding of a layer of voluntary cuts, with its next scheduled review being on the 6th of September.
The disruption is most impactful for natural gas. ADNOC Gas reported a 52% decline in profits for Q2 2022 compared to Q2 2021 and in total a decline of $665 million, attributed to the closure of the Strait of Hormuz. The company has adjusted its full year profits to $3.5-4 billion compared to
US gas offers some cushioning. EIA data reports working inventories reached 3,117 Bcf following a bigger-than-expected 33 Bcf injection, leaving storage 195 Bcf above the five-year average. In the meantime, Cheniere shipped out 184 LNG cargoes in Q2, up 19.4% from the year prior, and lifted its 2026 EBITDA range to $7.9-$8.4 billion on the strength of global LNG demand. The EIA’s new Short-Term Energy Outlook is set to drop on August 11th, so its fresh forecasts for oil-production, LNG, and gas-demand will be the next major fundamental changes.

Natural Gas Technical Analysis: Trendline Breakout Meets EMA Resistance Near $2.80
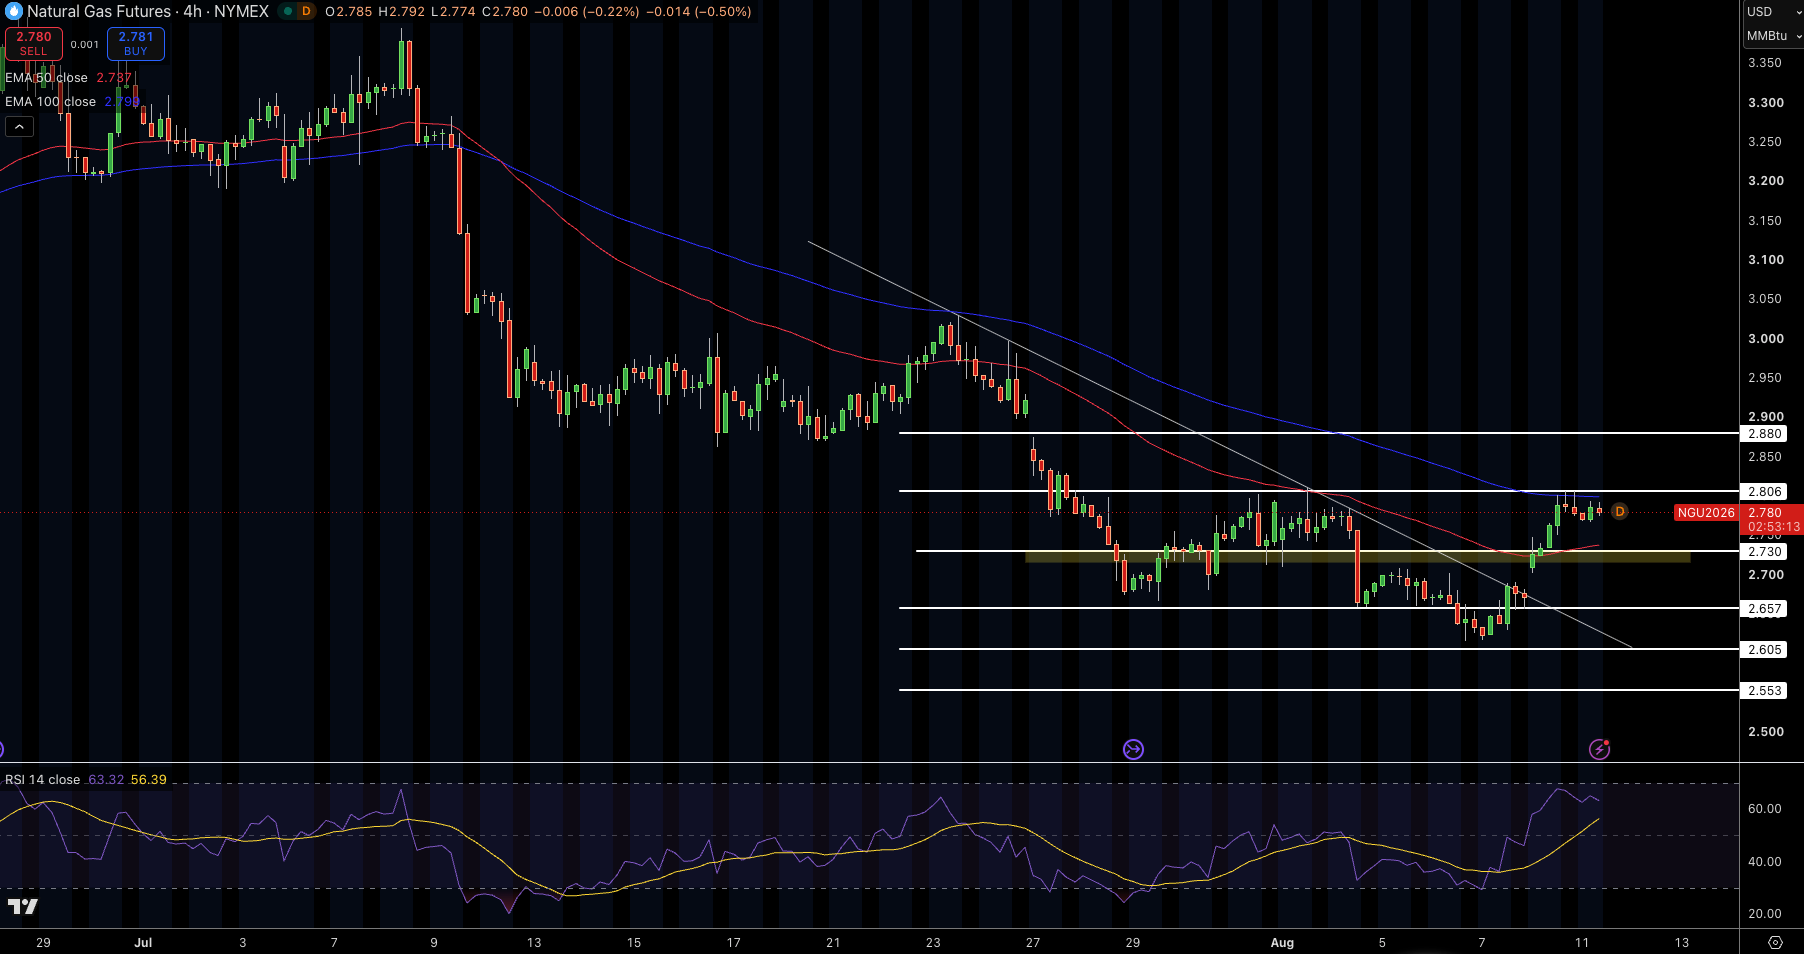
Natural Gas is trading at $2.78. It has broken the falling trend line and the previous resistance zone at $2.73. It is currently testing the 50 EMA at $2.79, the 100 EMA at $2.80, and a resistance zone at $2.81. The buyers are holding the zone that was previously a resistance area and have not shown any willingness to take profit.
RSI has risen, and is signaling a bullish zone at $2.81, with $2.88 as the next bullish target. The recent support is set at $2.73, with additional support set at $2.66 and $2.61.
In my view, if the price holds the zone at $2.73, the bullish scenario remains intact. However, a break above $2.81 would set the new bullish target at $2.88. A break below the EMA cluster would set the new target to the breakout zone.
Natural Gas Price Forecast
Every new Natural Gas analysis as it publishes, today's technical signal and key levels, live price — on one page.
See all Natural Gas forecastsWTI Crude Oil Technical Analysis: Trendline Breakout Puts $84.74 in Focus
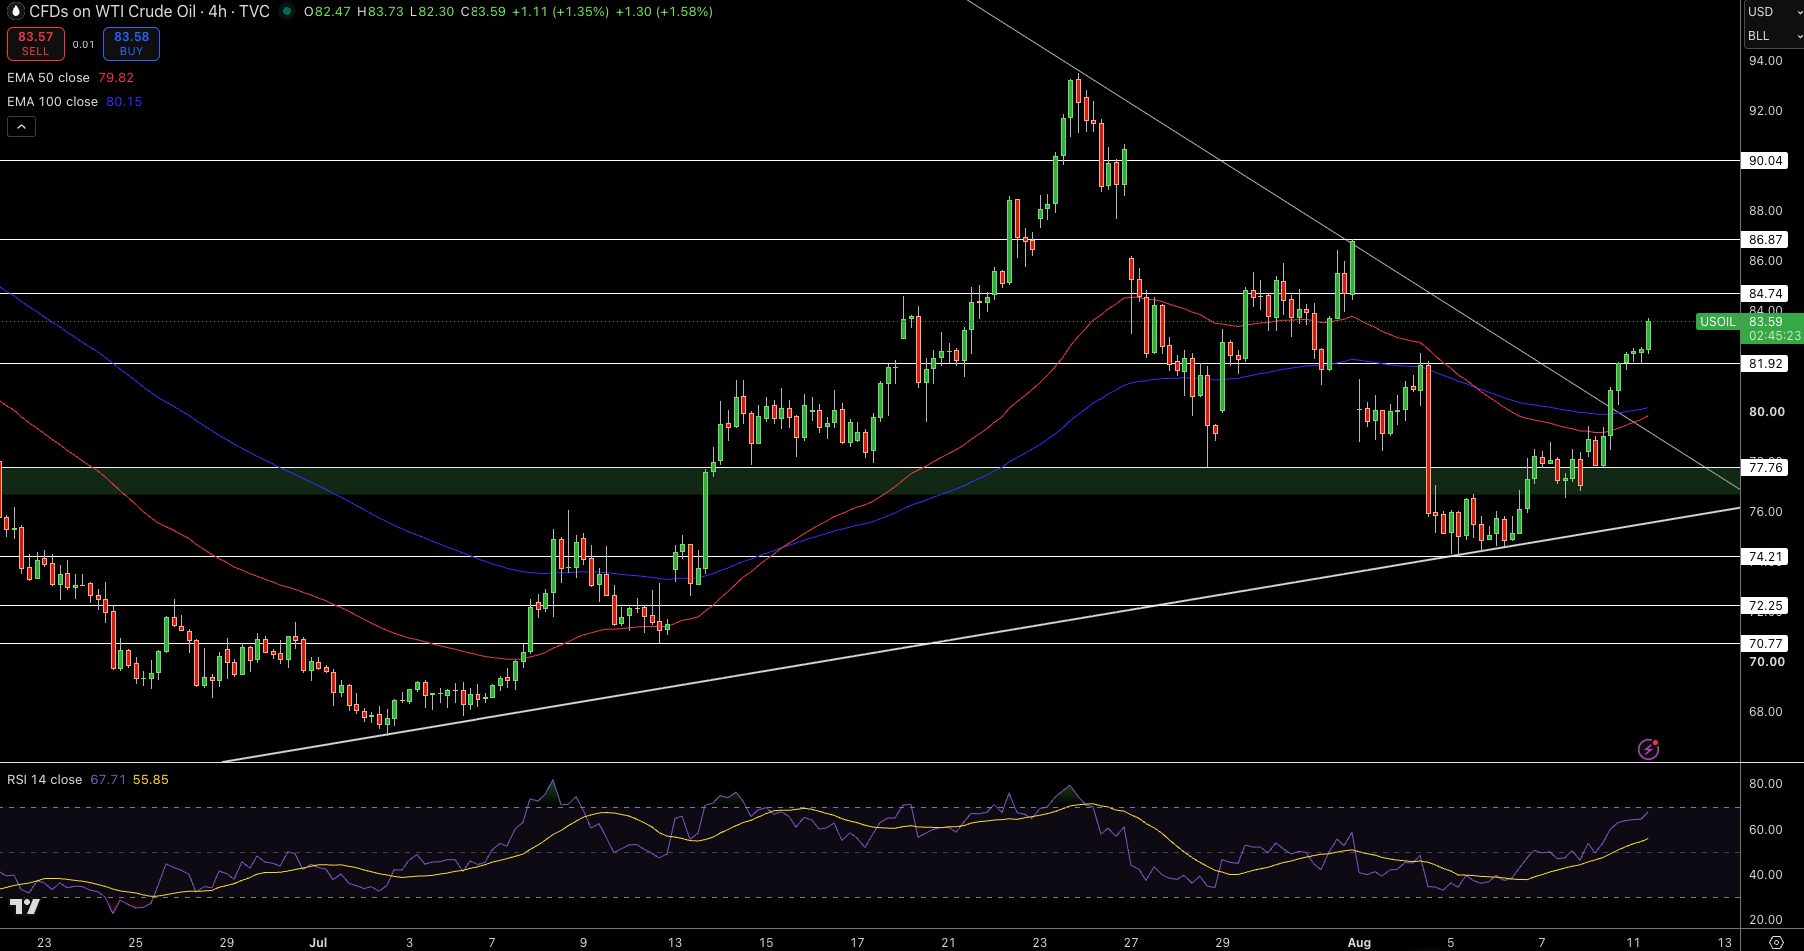
Currently, WTI crude is trading near $83.59 after a break above the descending trendline that capped gains since the recovery in late July. Price is above both the 50-EMA at $79.82 and 100-EMA at $80.15 with the new bullish candles signaling control of the bulls post breakout. RSI is now at 68, suggesting good momentum, and a bullish market that may be approaching overbought conditions.
Price is targeting $84.74 first and then likely $86.87 and $90.04. $81.92 is the first support level, with a stronger support in the EMA cluster at $79.80 – $80.15. A break below that area would put $77.76 back in focus.
I am bullish on the technical structure of WTI while it stays above $81.92. If $84.74 gets broken to the upside, I expect an extension to $86.87. Below that level I expect a short consolidation.
Brent Crude Oil Technical Analysis: Breakout Extends Toward $91.13 Resistance
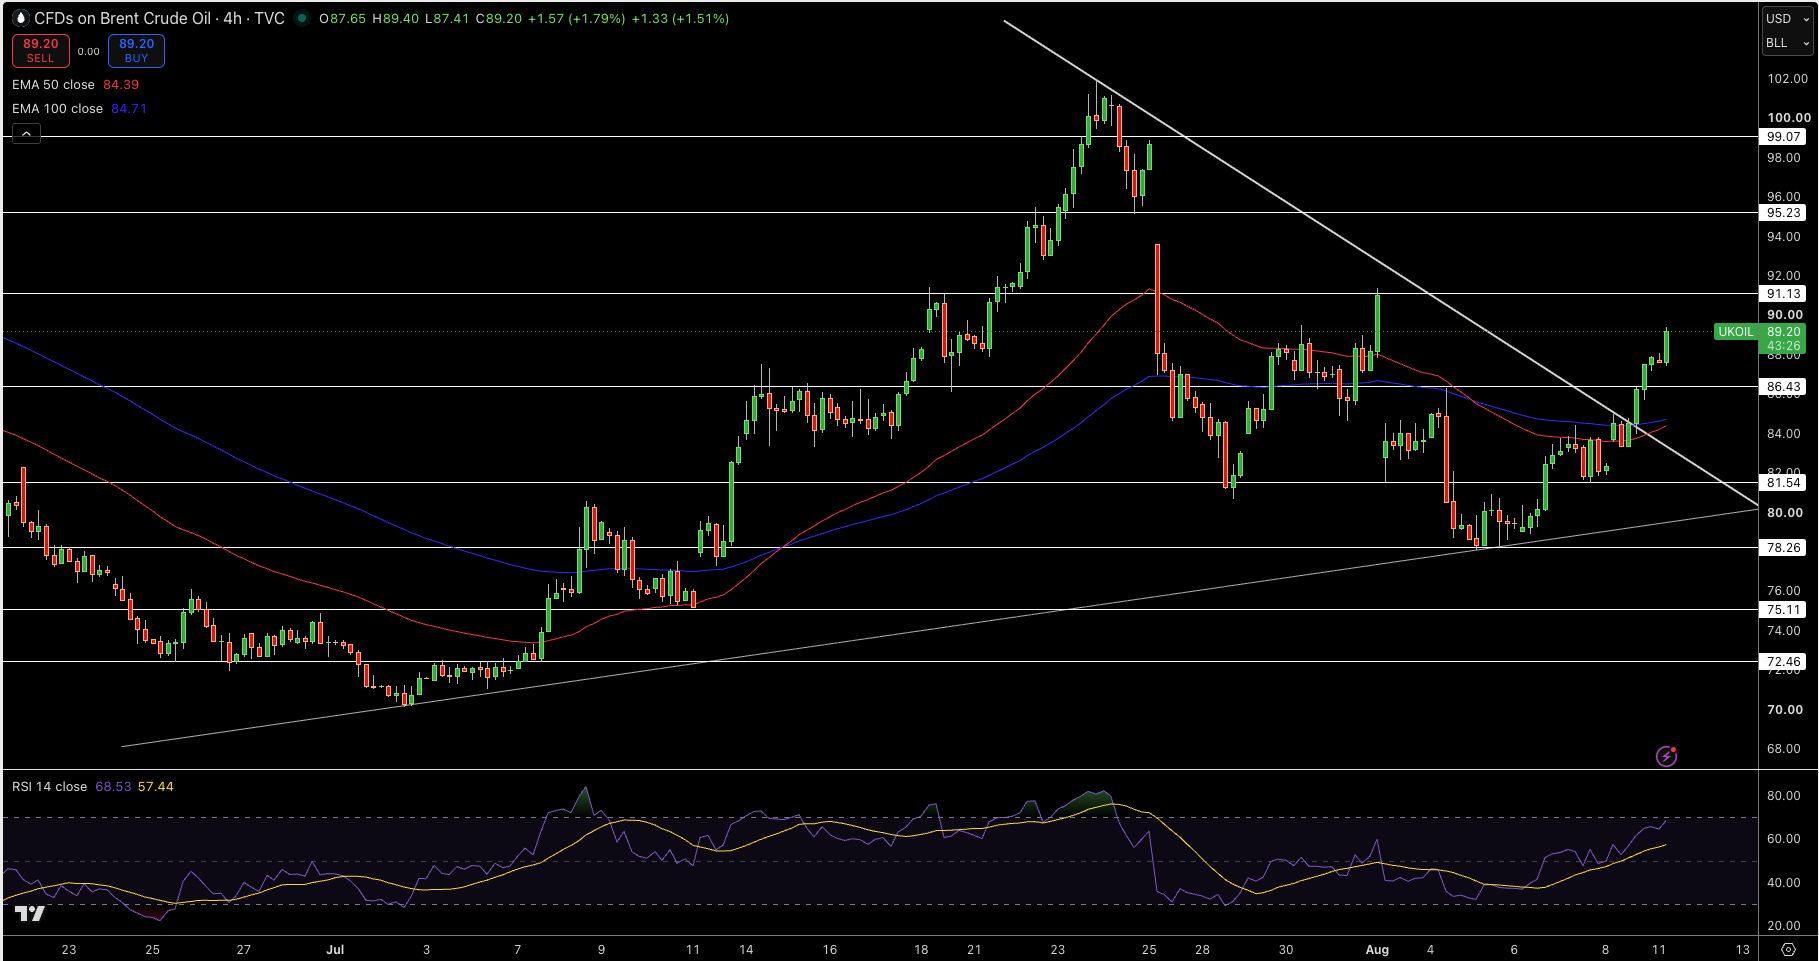
Brent crude oil is currently trading at around $89.20. This strengthening trend breaks the long-standing descending trend line of the 4-hour chart, and shows that Brent crude oil has a bullish trend. Currently, Brent crude oil is above not only the descending trend line, but also the 50 EMA at $84.39 and the 100 EMA at $84.71. This shows that the bearish trend in Brent crude oil has greatly weakened. The recent bullish trend is further supported by a number of bullish candlesticks, and the RSI is at 69 which shows that the current bullish trend is very strong, but is almost in an overbought state.
The nearest significant bearish target is at $91.13, followed by the levels at $95.23 and $99.07. The moving average convergence divergence, or MACD, suggests the first support is at $86.43 with an additional support level at $84.40 – $84.70. A continued downward movement may bring $81.54 back into play.
Technically, Brent crude is in a medium to long-term bull trend since it has managed to hold above $86.43, the former breakout level. More evidence of an upward continuation would be a break above $91.13. The target price of $95.