
Iran Pause and Cooler Forecasts Send Gas Lower
September natural gas broke to a three-month low Tuesday as the Iran truce talk pulled crude and European gas prices lower while domestic weather forecasts turned against the bulls again. Texas is still hot. The Plains are running triple digits. None of that matters for September because the Midwest and Northeast keep getting cooler breaks and the national demand picture is not lining up. Production hit 113.1 Bcf per day Monday, storage is above the five-year average and sellers have everything they need to press this market lower heading into Thursday’s EIA report.
At 15:54 GMT, September natural gas futures are trading $2.682, down $0.106 or -3.80%.
The Iran pause gave European gas prices a reason to drop and that removed one of the supports that had been helping U.S. futures hold earlier in the month. The domestic balance was already heavy. Losing the global premium on top of it gave sellers room to take the market apart Tuesday afternoon.

Daily September Natural Gas Technical Analysis
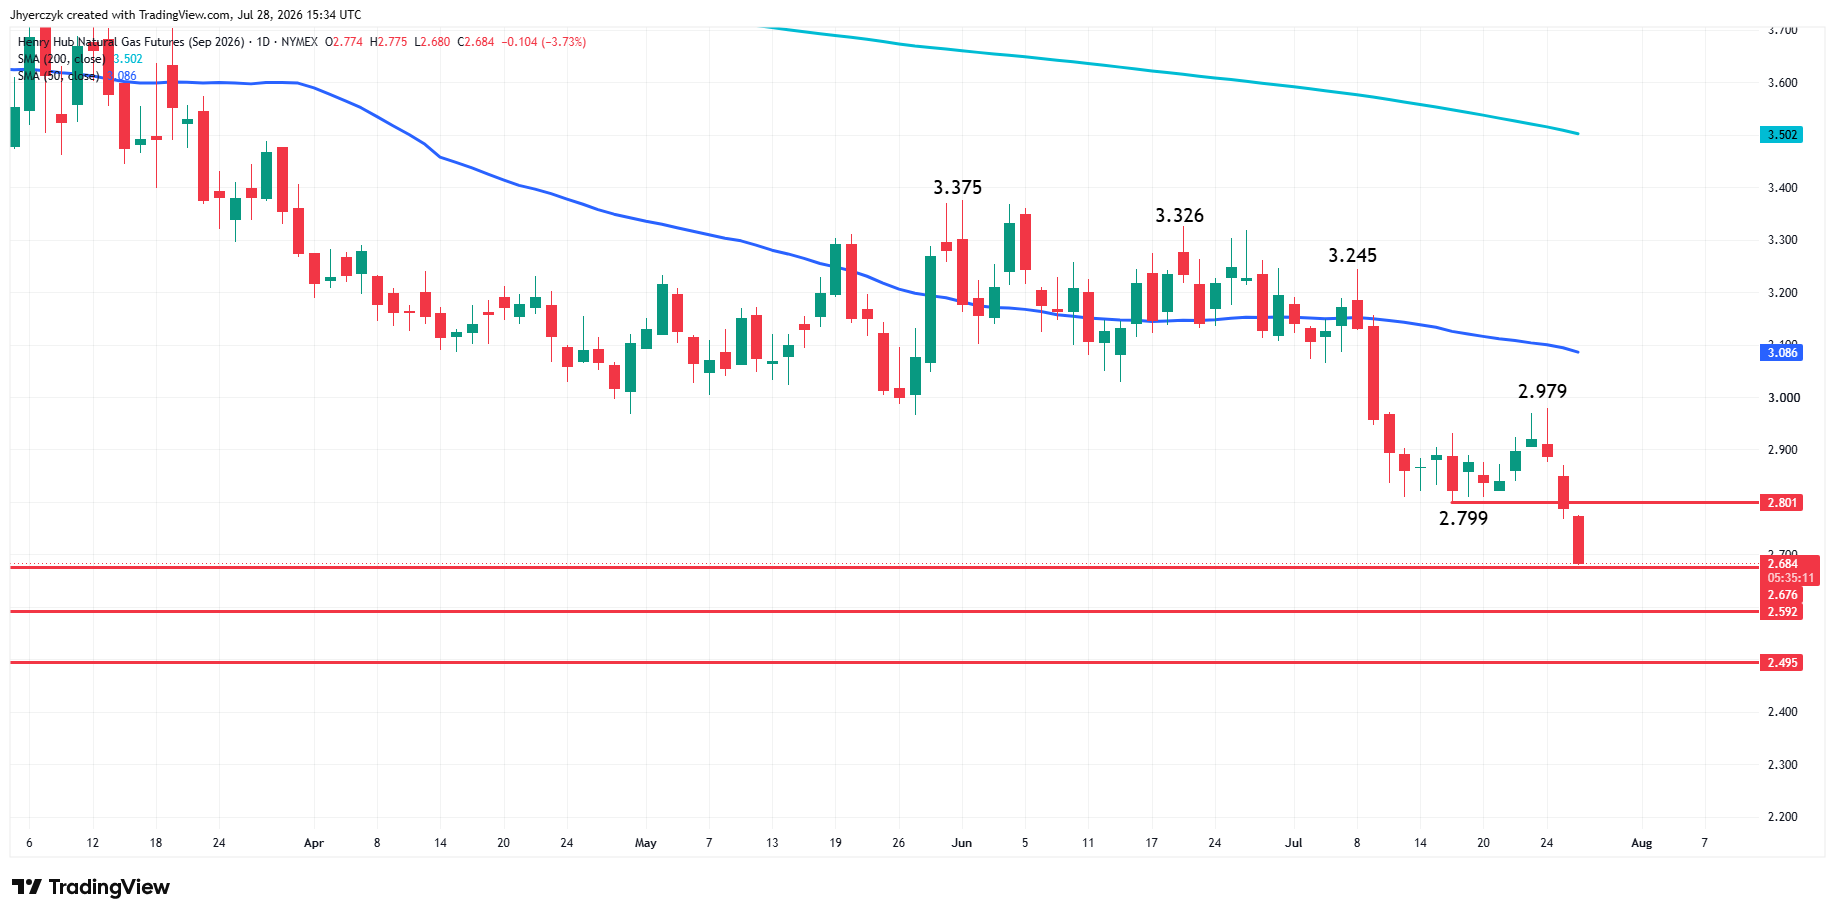
September natural gas futures are sharply lower on Tuesday after yesterday’s weak close under the previous low at $2.799 took out enough sell stops to fuel a plunge into a long-term bottom at $2.676. The downside momentum created by the move suggests the selling may even extend into the next long-term bottom at $2.592.
The nearest resistance is the previous low at $2.799, followed by the swing top at $2.979 and the 50-day moving average at $3.085.
I’m not trying to predict a bottom, but the market is trading $0.40 below the 50-day MA, which is pretty steep. To some, this may indicate September natural gas is getting close to being oversold. An oversold market doesn’t mean the trend is getting ready to reverse, but prices could begin to consolidate.
Regional Heat Cannot Carry a National Market
Texas and the Plains are running highs in the 90s and 100s with some readings hitting the 110s. ERCOT load is keeping gas-fired power demand elevated in the South. That is not new and it has not been enough all summer.
Natural Gas Price Forecast
Every new Natural Gas analysis as it publishes, today's technical signal and key levels, live price — on one page.
See all Natural Gas forecastsThe forecast for August 1 through August 5 turned cooler across the central and eastern United States and that was the number that broke this market Tuesday. The Midwest, Great Lakes and Northeast are the regions that matter for national demand and they keep getting relief before the heat can build into anything sustained. Seven-day demand is still running high according to NatGasWeather but the coverage is regional and regional has not been enough all summer.
Sellers watched this cycle play out every week in July. Texas gets hot, the East cools off, the bid dies. Tuesday’s plunge says they are done waiting to see if August is any different.
LNG Floor Holds but the Iran Pause Weakened It
LNG net flows to U.S. export terminals were 18.1 Bcf per day Monday, up 2.4% from the prior week. Europe entered late July with storage only 55% full against a five-year average near 71%. That winter deficit is real and it keeps LNG demand relevant underneath this market.
The Iran pause knocked European gas prices lower Tuesday and that pulled the rug out from under the one international support U.S. futures had left. Freeport is still in maintenance and Gulf Coast feedgas demand has been running below summer highs for weeks. The European premium was papering over that weakness and now it is gone. September was holding above $2.80 on the combination of domestic weather and overseas demand. When the overseas piece dropped out, the domestic balance took over and the domestic balance is bearish.
The LNG floor is still in place. It is thinner today than it was a week ago.
Supply Side Keeps Growing Into the Weakness
Lower-48 dry gas production hit 113.1 Bcf per day Monday, up 3.7% from a year earlier. Demand was 81.4 Bcf per day, up 2.7% from a year ago. The gap between supply and demand is the reason September cannot hold a rally. Output is growing faster than consumption and the EIA raised its 2026 forecast to 111.2 Bcf per day earlier this month.
The rig count rose by one to 127 last week, below February’s three-year high of 134. No fresh production surge is showing up but what is already flowing is more than enough to keep the storage surplus intact.
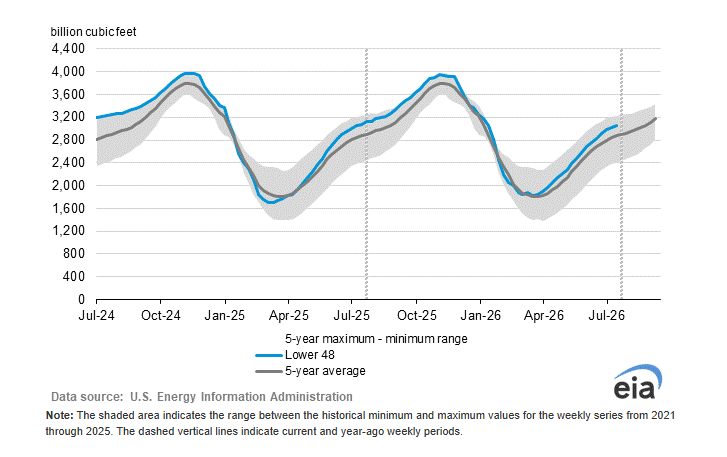
Storage told the same story last week. The EIA printed a 32 Bcf injection for the week ending July 17, slightly below the 34 Bcf estimate but still above the five-year average build of 30 Bcf. Inventories are running 6.4% above the five-year seasonal average. Thursday’s report is the next test and another normal or above-normal build keeps sellers comfortable pressing this market lower.
What to Watch
Thursday’s EIA report and the next weather update land into a market that just broke a long-term bottom on heavy selling. A tight injection paired with a hotter August forecast would be the first time both catalysts lined up for bulls all summer. Anything short of that combination and sellers stay in control after Tuesday’s break.
The market plunged through a long-term bottom Tuesday and the momentum suggests the next one below is in range. September is trading well below its 50-day average and the distance is getting steep enough that consolidation or a technical bounce is possible. But oversold does not mean the trend is turning. It means the selling could slow down before it either resumes or the weather finally gives buyers something real to work with.
More Information in our Economic Calendar.