Support Failure Opens the Door to Deeper Losses
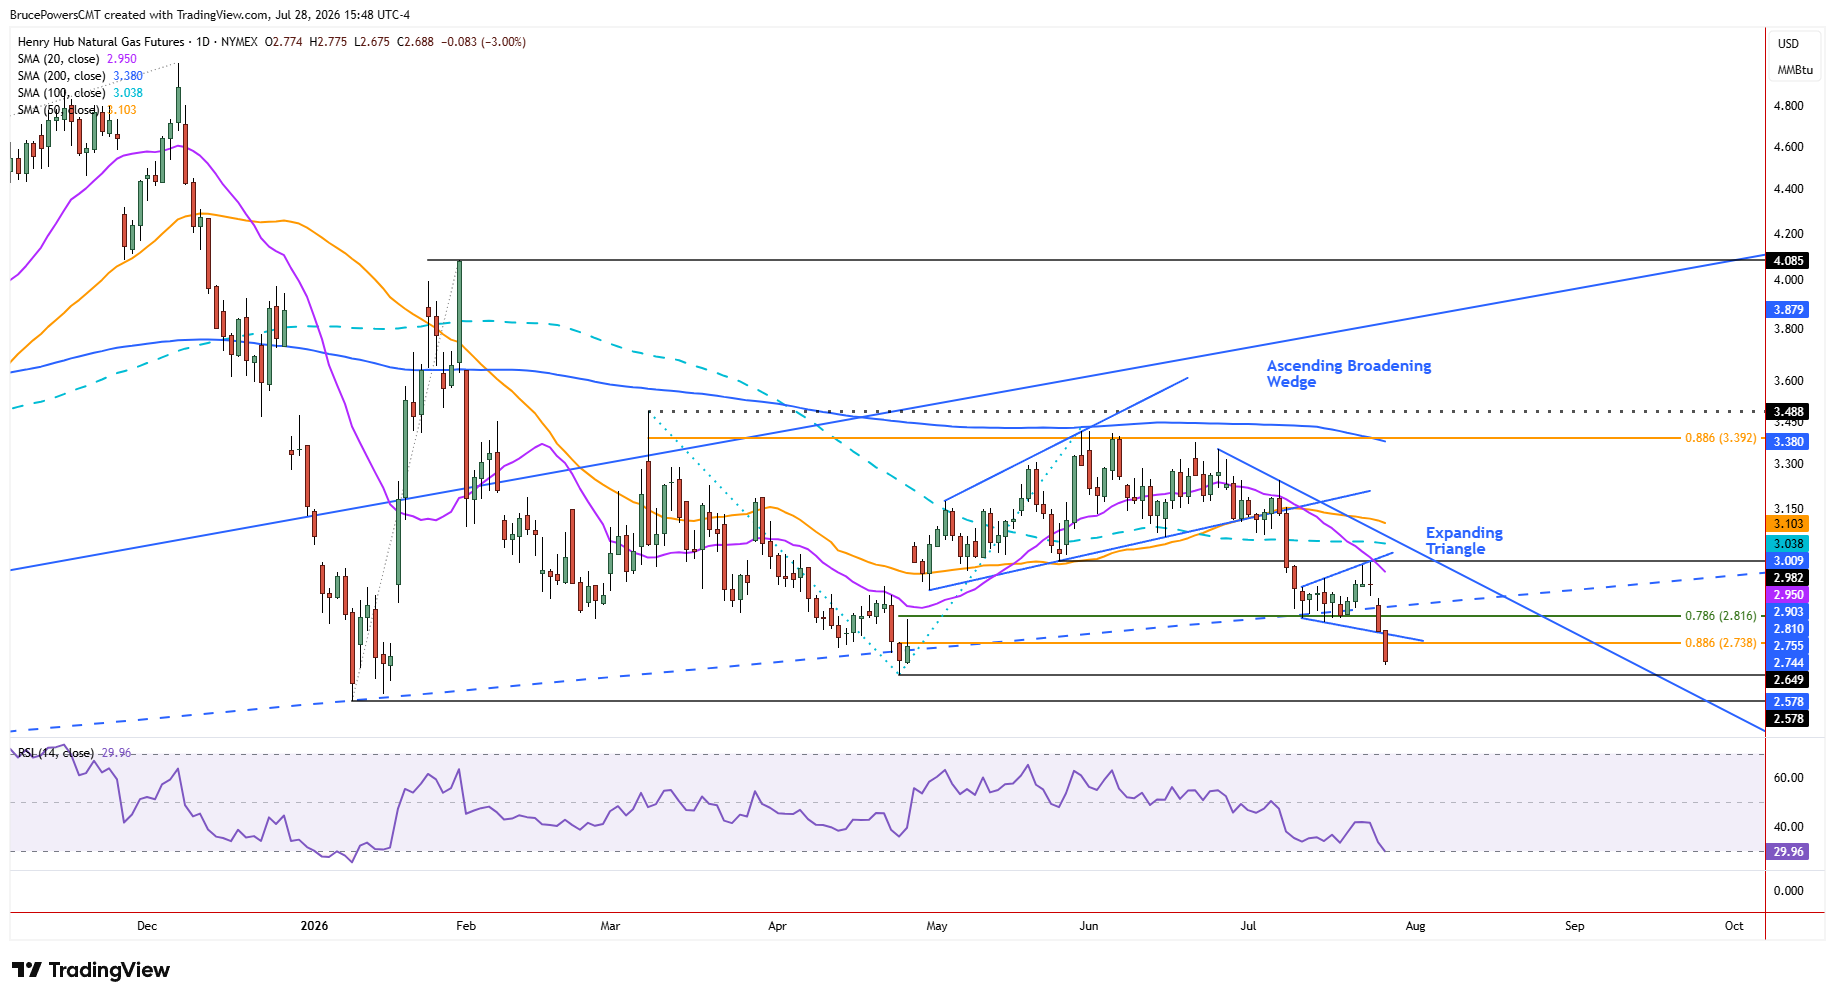
Natural gas triggered a bearish continuation of its decline on Tuesday, breaking below Monday’s low and reaching a new corrective low of $2.68. The decline triggered a decisive bearish breakout from a small expanding triangle consolidation pattern that had formed at a key support zone but failed to find support near the next lower target of $2.74, defined by the 88.6% Fibonacci retracement of the prior advance.
The failure of that support zone leaves the $2.58 to $2.65 area as the next important downside region to watch. A decisive break below that zone would carry greater implications for the larger bearish structure now developing.

A Larger Bearish Structure Takes Shape
This week’s bearish behavior has potential long-term implications for the larger developing pattern in natural gas, as it further confirms the bearish implications of the recent lower swing high of $3.42 from early June. Both the trend continuation signal on Tuesday and the failure to find support near the 88.6% Fibonacci retracement level indicate that the larger trend low of $2.65 from April may be broken. That would further confirm that sellers are back in control, while also putting the higher swing low of $2.58 from January at risk of being broken.
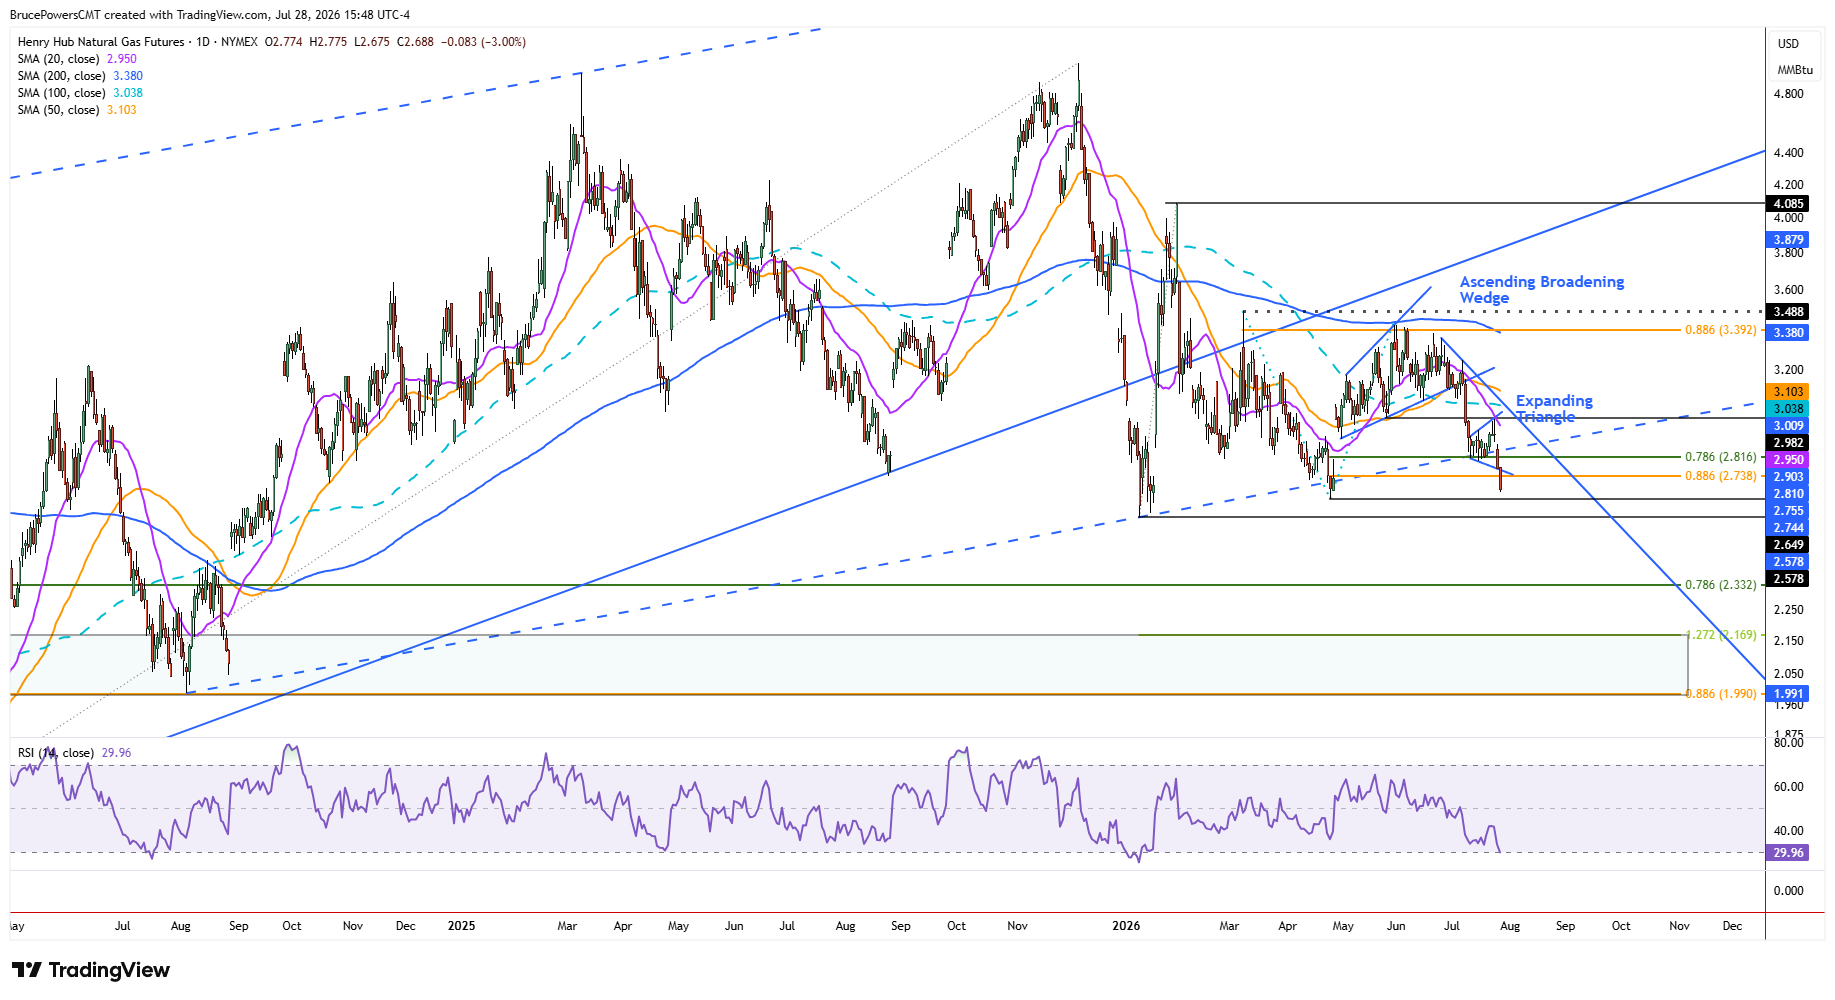
A decline below the April low of $2.65 would signal a continuation of the bearish trend that began with the January swing high near $4.09, while a decline below the January low of $2.58 would trigger a continuation of the bearish trend from the December peak of $5.02. The smaller downtrend structure is contained within the larger bearish structure of lower swing highs and lower swing lows.
This nested structure means that a break below $2.65 would strengthen the near-term bearish trend, while a break below $2.58 would carry broader implications for the larger trend that began from the December peak. In other words, the $2.65 and $2.58 levels represent increasingly important confirmation points as the bearish structure unfolds.
Former Support Turns Iinto Resistance
By the beginning of this year, natural gas had triggered a breakdown from the rising trendline and the 200-day moving average. Each trend indicator had defined potential dynamic support for the advance that began from the 2024 low. The recent lower swing high at $3.42 completed the first notable pullback to test those indicators as areas of resistance instead of support. Once that process completes, the bearish trend could be signaling that it may be ready to proceed.
Natural Gas Price Forecast
Every new Natural Gas analysis as it publishes, today's technical signal and key levels, live price — on one page.
See all Natural Gas forecasts$2.58 Becomes the Line in the Sand
Tuesday’s short-term bearish price action is further confirming the possibility that the larger bearish structure will also be confirmed by an eventual decisive decline below $2.58. That would put natural gas on track to test support near the 78.6% Fibonacci retracement of the entire prior advance from the 2024 low. For now, the failure of the $2.74 support target has shifted attention toward the $2.65 April low and then $2.58, making those levels increasingly important in determining whether Tuesday’s breakdown develops into a broader bearish continuation.
If you’d like to know more about how to trade natural gas, please visit our educational area.