Support Zone Shows Early Signs of Stabilizing
Natural gas consolidated on Wednesday within Tuesday’s price range of $2.64 to $2.76 and near a support zone anchored by the 78.6% Fibonacci retracement of the prior advance at $2.69. While Tuesday’s close near $2.64 confirmed an extension of the bearish trend and a break below the 78.6% retracement, Wednesday’s price range of $2.67 to $2.74, as of the time of writing, was largely above the Fibonacci support level. This is a minor sign of strength that contrasts with Friday’s bearish closing signal and hints that sellers may be losing some momentum near support.
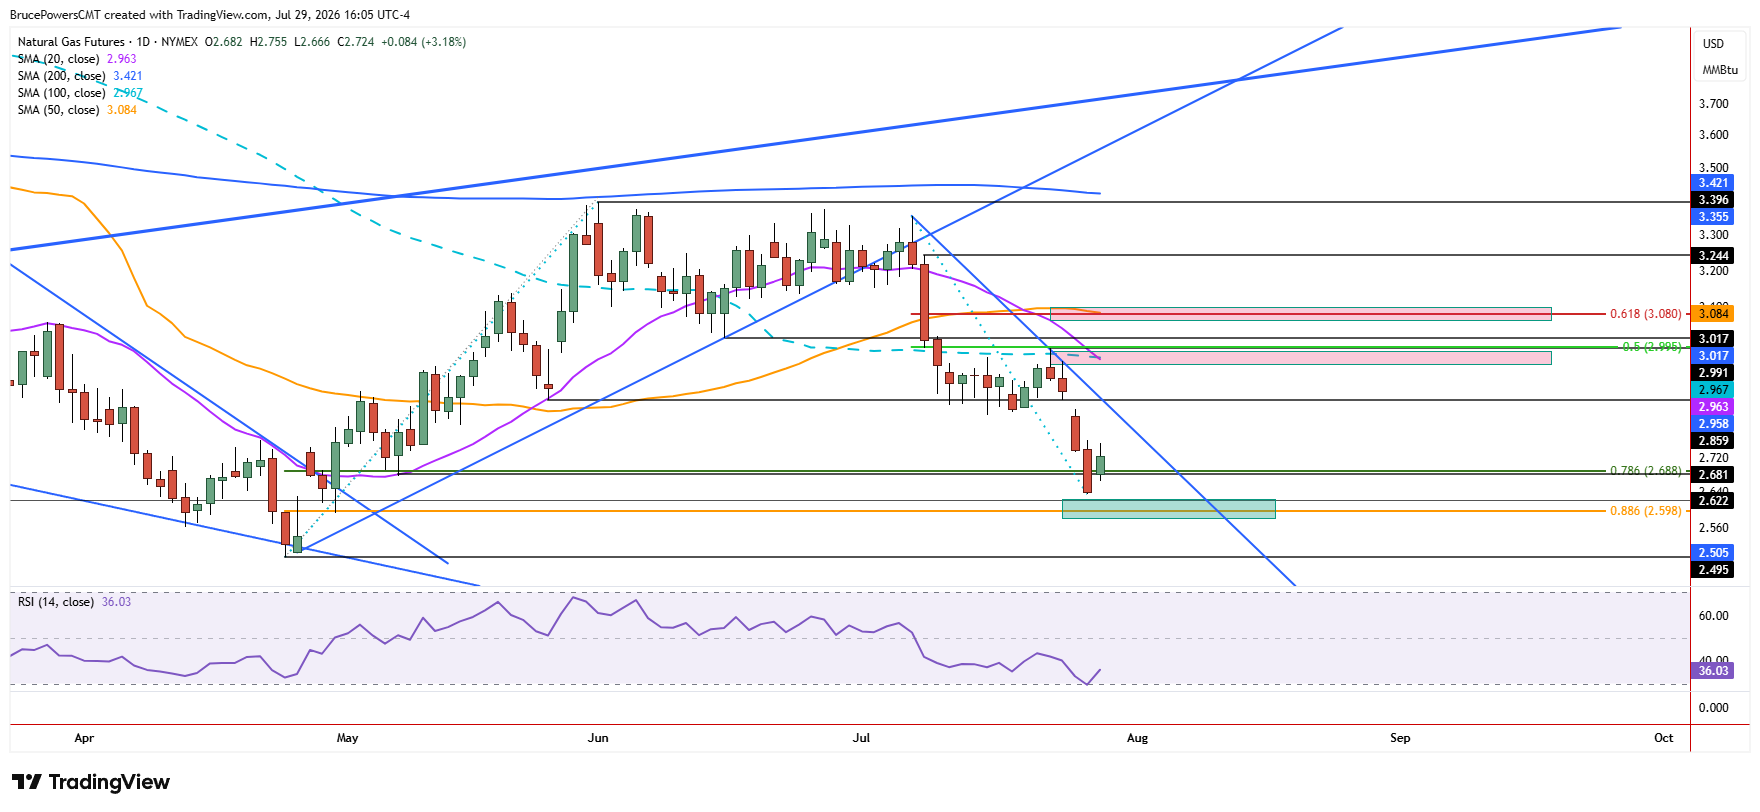
Nevertheless, a deeper decline looks likely to find support near the 88.6% Fibonacci retracement of $2.60. Since it is not much lower than the current low, bearish momentum may be approaching exhaustion, leaving open the possibility of a countertrend rally toward trend resistance zones. A short-term bullish reversal signal would occur on a rally above Tuesday’s high of $2.76, putting natural gas on course to test the first target zone around $2.86.

Resistance Zones Could Cap Any Recovery
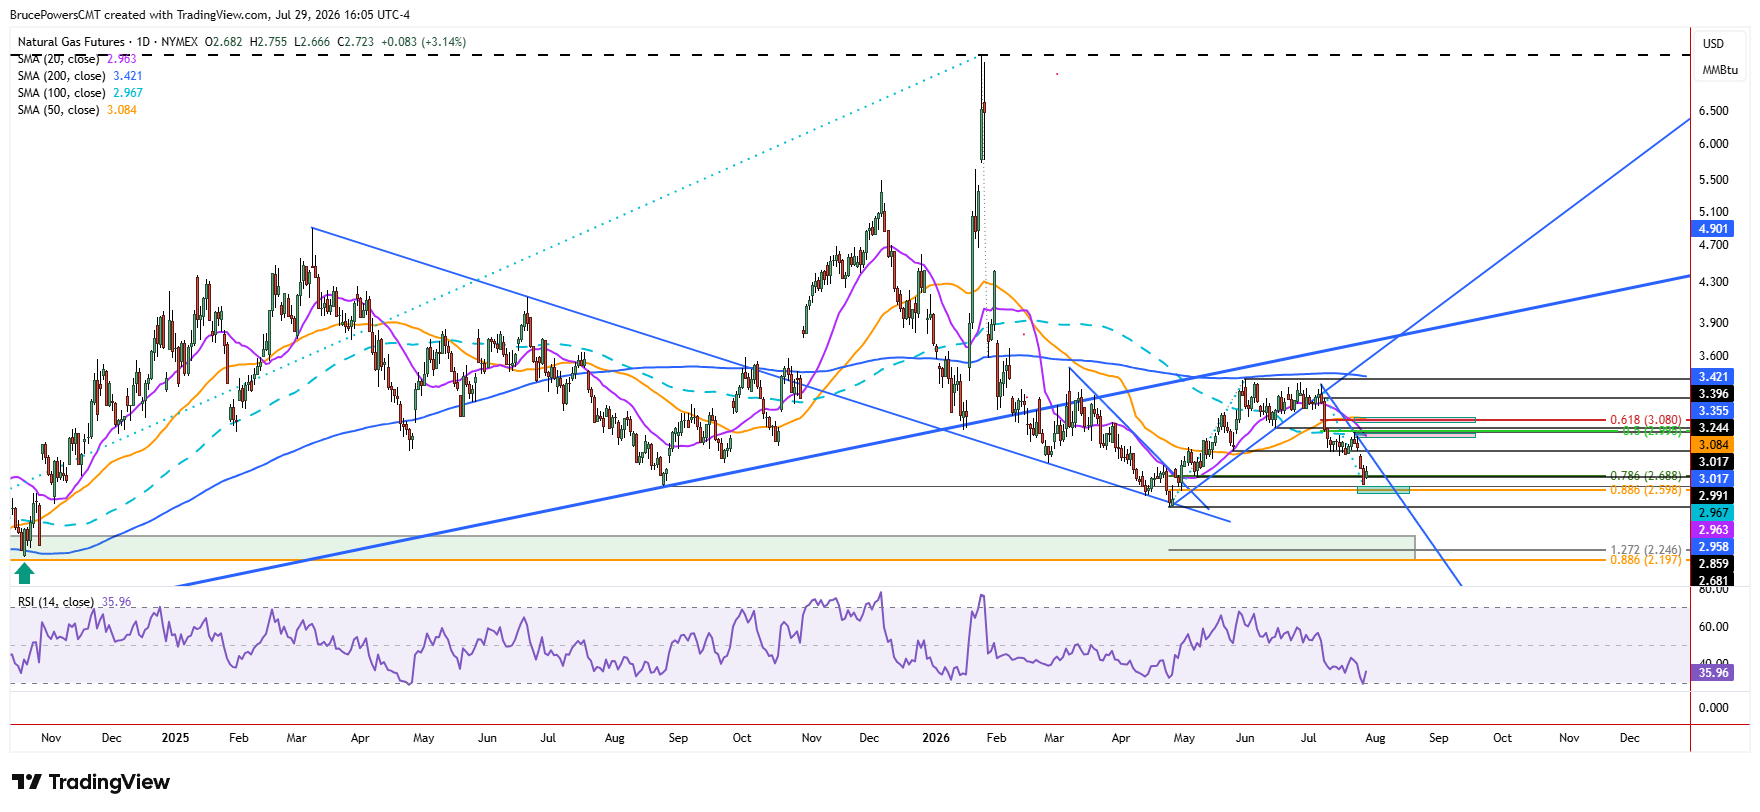
There is a more significant upside target zone from around $2.96 to $2.99. That price zone includes the 20-day moving average, currently at $2.96 and falling; the 100-day moving average at $2.97; and the lower swing high that marks the top of a small consolidation range at $2.99. That confluence of resistance indicators suggests the area could provide strong resistance, while also increasing the likelihood that price is attracted to the zone before the advance is complete.
Further up is another target near $3.08, derived from the confluence of the 61.8% Fibonacci retracement of the prior decline and the 50-day moving average. Keep in mind that the 50-day moving average is falling and will therefore represent a progressively lower dynamic resistance level as time goes on.
Broader Downtrend Remains the Dominant Force
Given the broader bearish trend, rallies are likely to eventually hit resistance and resume the prevailing downtrend. The recent lower swing high of $3.40 at the beginning of June and the subsequent trend breakdown confirm that the bearish trend remains in force. Unless natural gas reclaims nearby resistance levels, the broader downtrend suggests any rebound is likely to remain corrective before an eventual test of lower support levels. Those components of a declining trend structure suggest an eventual test of support at the April low near $2.50, with a high probability of a downside breakout if sellers remain in control.