Breakout Brings Buyers Back
The stock of Nebius Group N.V. (NBIS), an AI cloud infrastructure company, gapped higher on Wednesday following the release of its Q2 2026 earnings report before the market opened. It hit a high of $253.13 for the day after breaking out of an inverse head-and-shoulders bottoming pattern and reclaiming the 50-day moving average.
The neckline of the pattern near $229.47, along with the 50-day average near $221.69 marked a key resistance zone that was decisively broken to the upside during the advance. Participation was broad, with daily volume spiking to its highest level since mid-March. The combination of the pattern breakout, moving average reclaim, strong volume, and bullish close provides several indications that the advance may have further room to run.
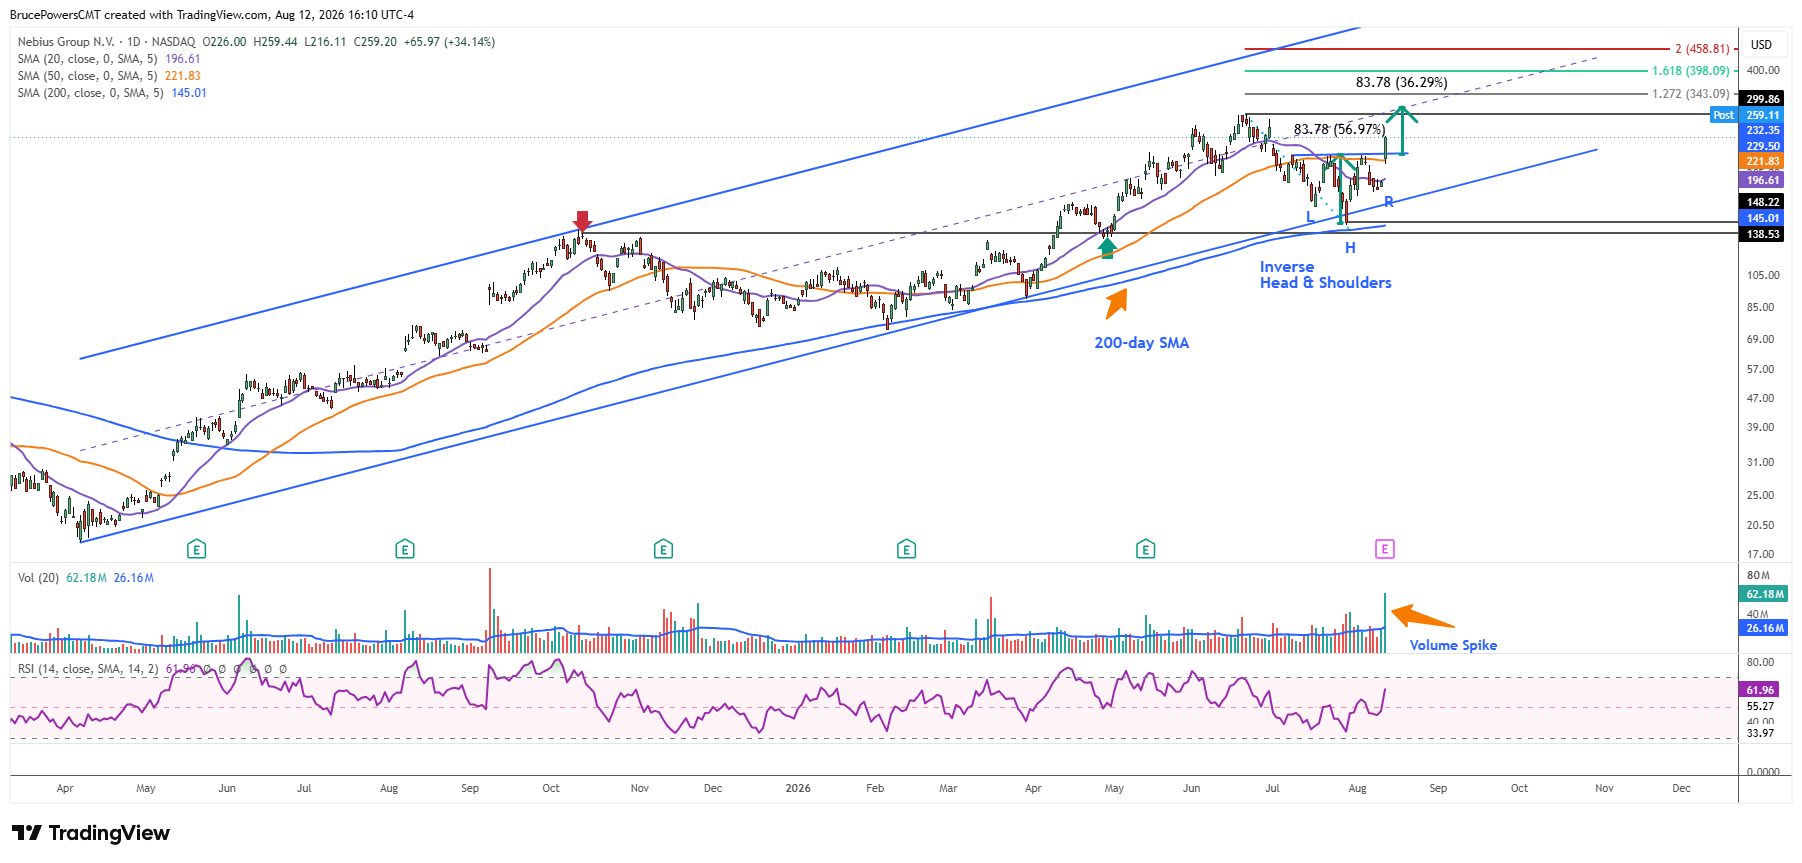
Although further confirmation of strength is needed, NBIS is off to a good start with a new bullish signal from a classic reversal pattern. This indicates that the bearish correction may be complete and that a new leg higher could be beginning within the larger uptrend structure of higher swing highs and higher swing lows. The breakout day, Wednesday, ended with buyers in control near the top of the day’s range. This suggests further upside may occur before a pullback. Nonetheless, short-term weakness could occur following the sharp advance, but it may not last long given the decisive breakout and strong close, reflecting strong interest in the stock.

Support Sets Up Next Leg
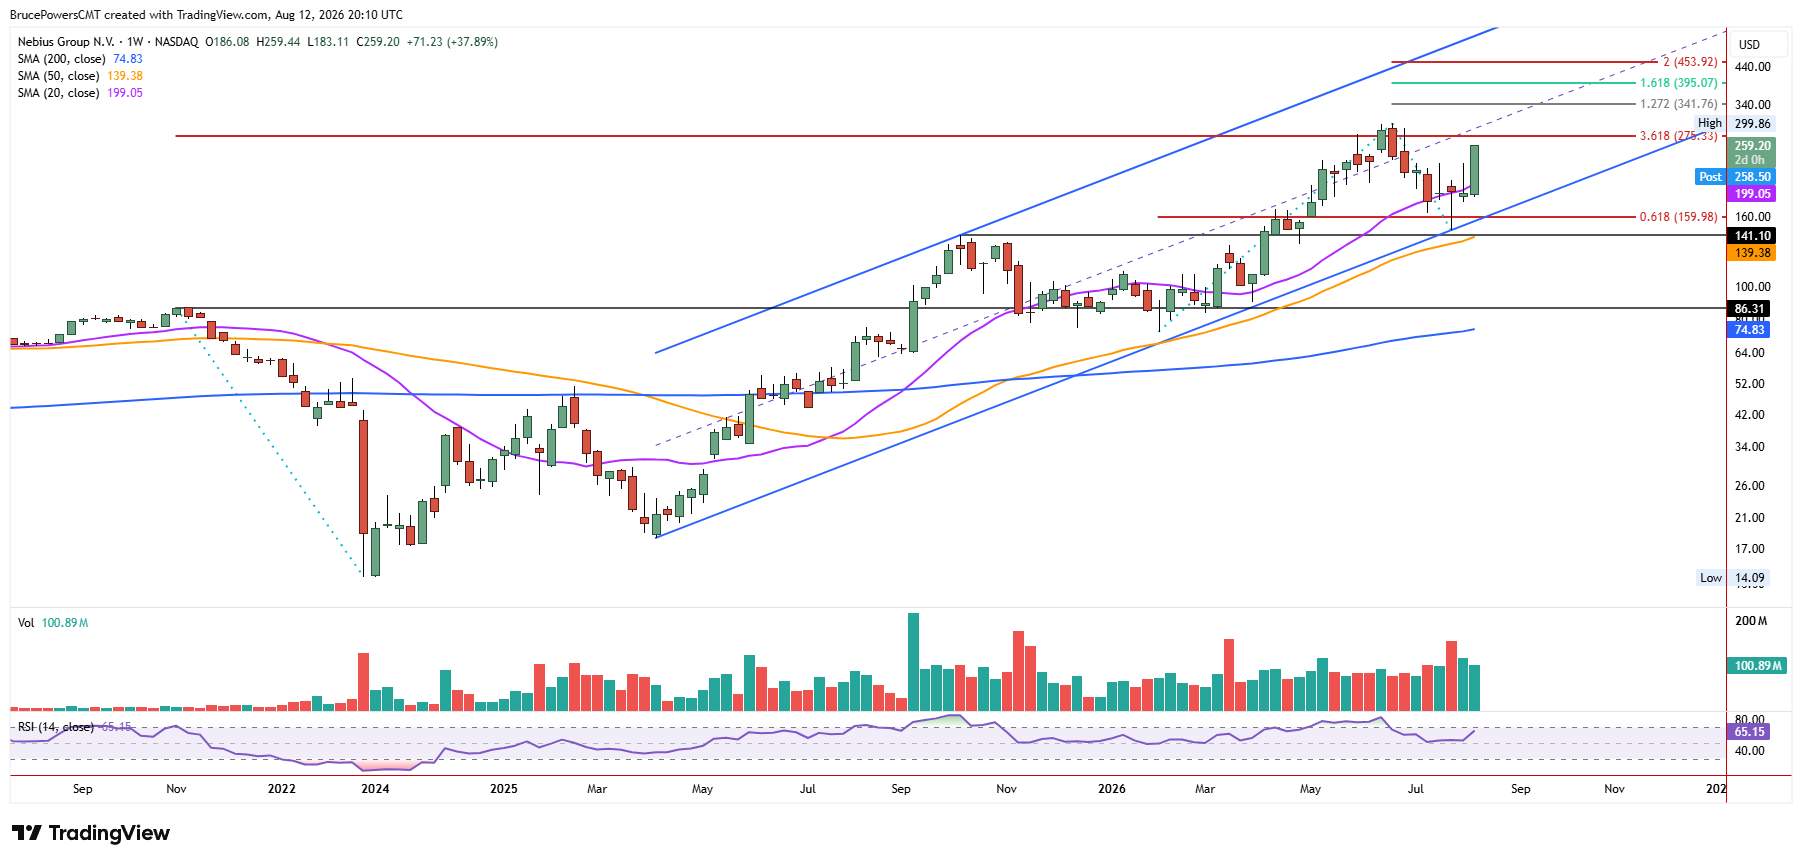
NBIS is rising from a long-term support zone that generated a higher swing low of $145.80 in late July. Support was seen near the confluence of several indicators, including the lower boundary of a rising parallel trend channel, the 200-day moving average, and a level from prior resistance. The successful test of this area preserved the broader bullish structure and provided the foundation for the latest breakout. As a result, the current advance is not occurring in isolation but follows a constructive sequence of support, higher lows, and renewed upside momentum.
Targets Stack Higher
NBIS is setting up for a classic continuation of a long-term bull trend that puts it on track towards the top of the rising channel. Nonetheless, the upward bias could see the prior peak of $299.86 exceeded towards an initial new high target of $343.09, which is the 127.2% Fibonacci extension of the recent pullback. That potential target is followed by the 161.8% Fibonacci extension of the same decline at $395.07.
A simple measuring objective derived from the head-and-shoulders bottom formation suggests a minimum target of around $314.80. Therefore, the ability of NBIS to sustain the breakout above the $221.69-229.47 resistance zone will be important. If that breakout holds, the pattern and Fibonacci objectives provide a series of progressively higher targets, beginning near $314.80 and extending toward $343.09 and eventually $395.07.
If you’d like to know more about technical analysis and how traders use it, please visit our educational area.