
The top-ranking cryptocurrencies, Bitcoin (BTC) and Ethereum (ETH), have started their new weekly session in the red, mirroring declines across risky markets.
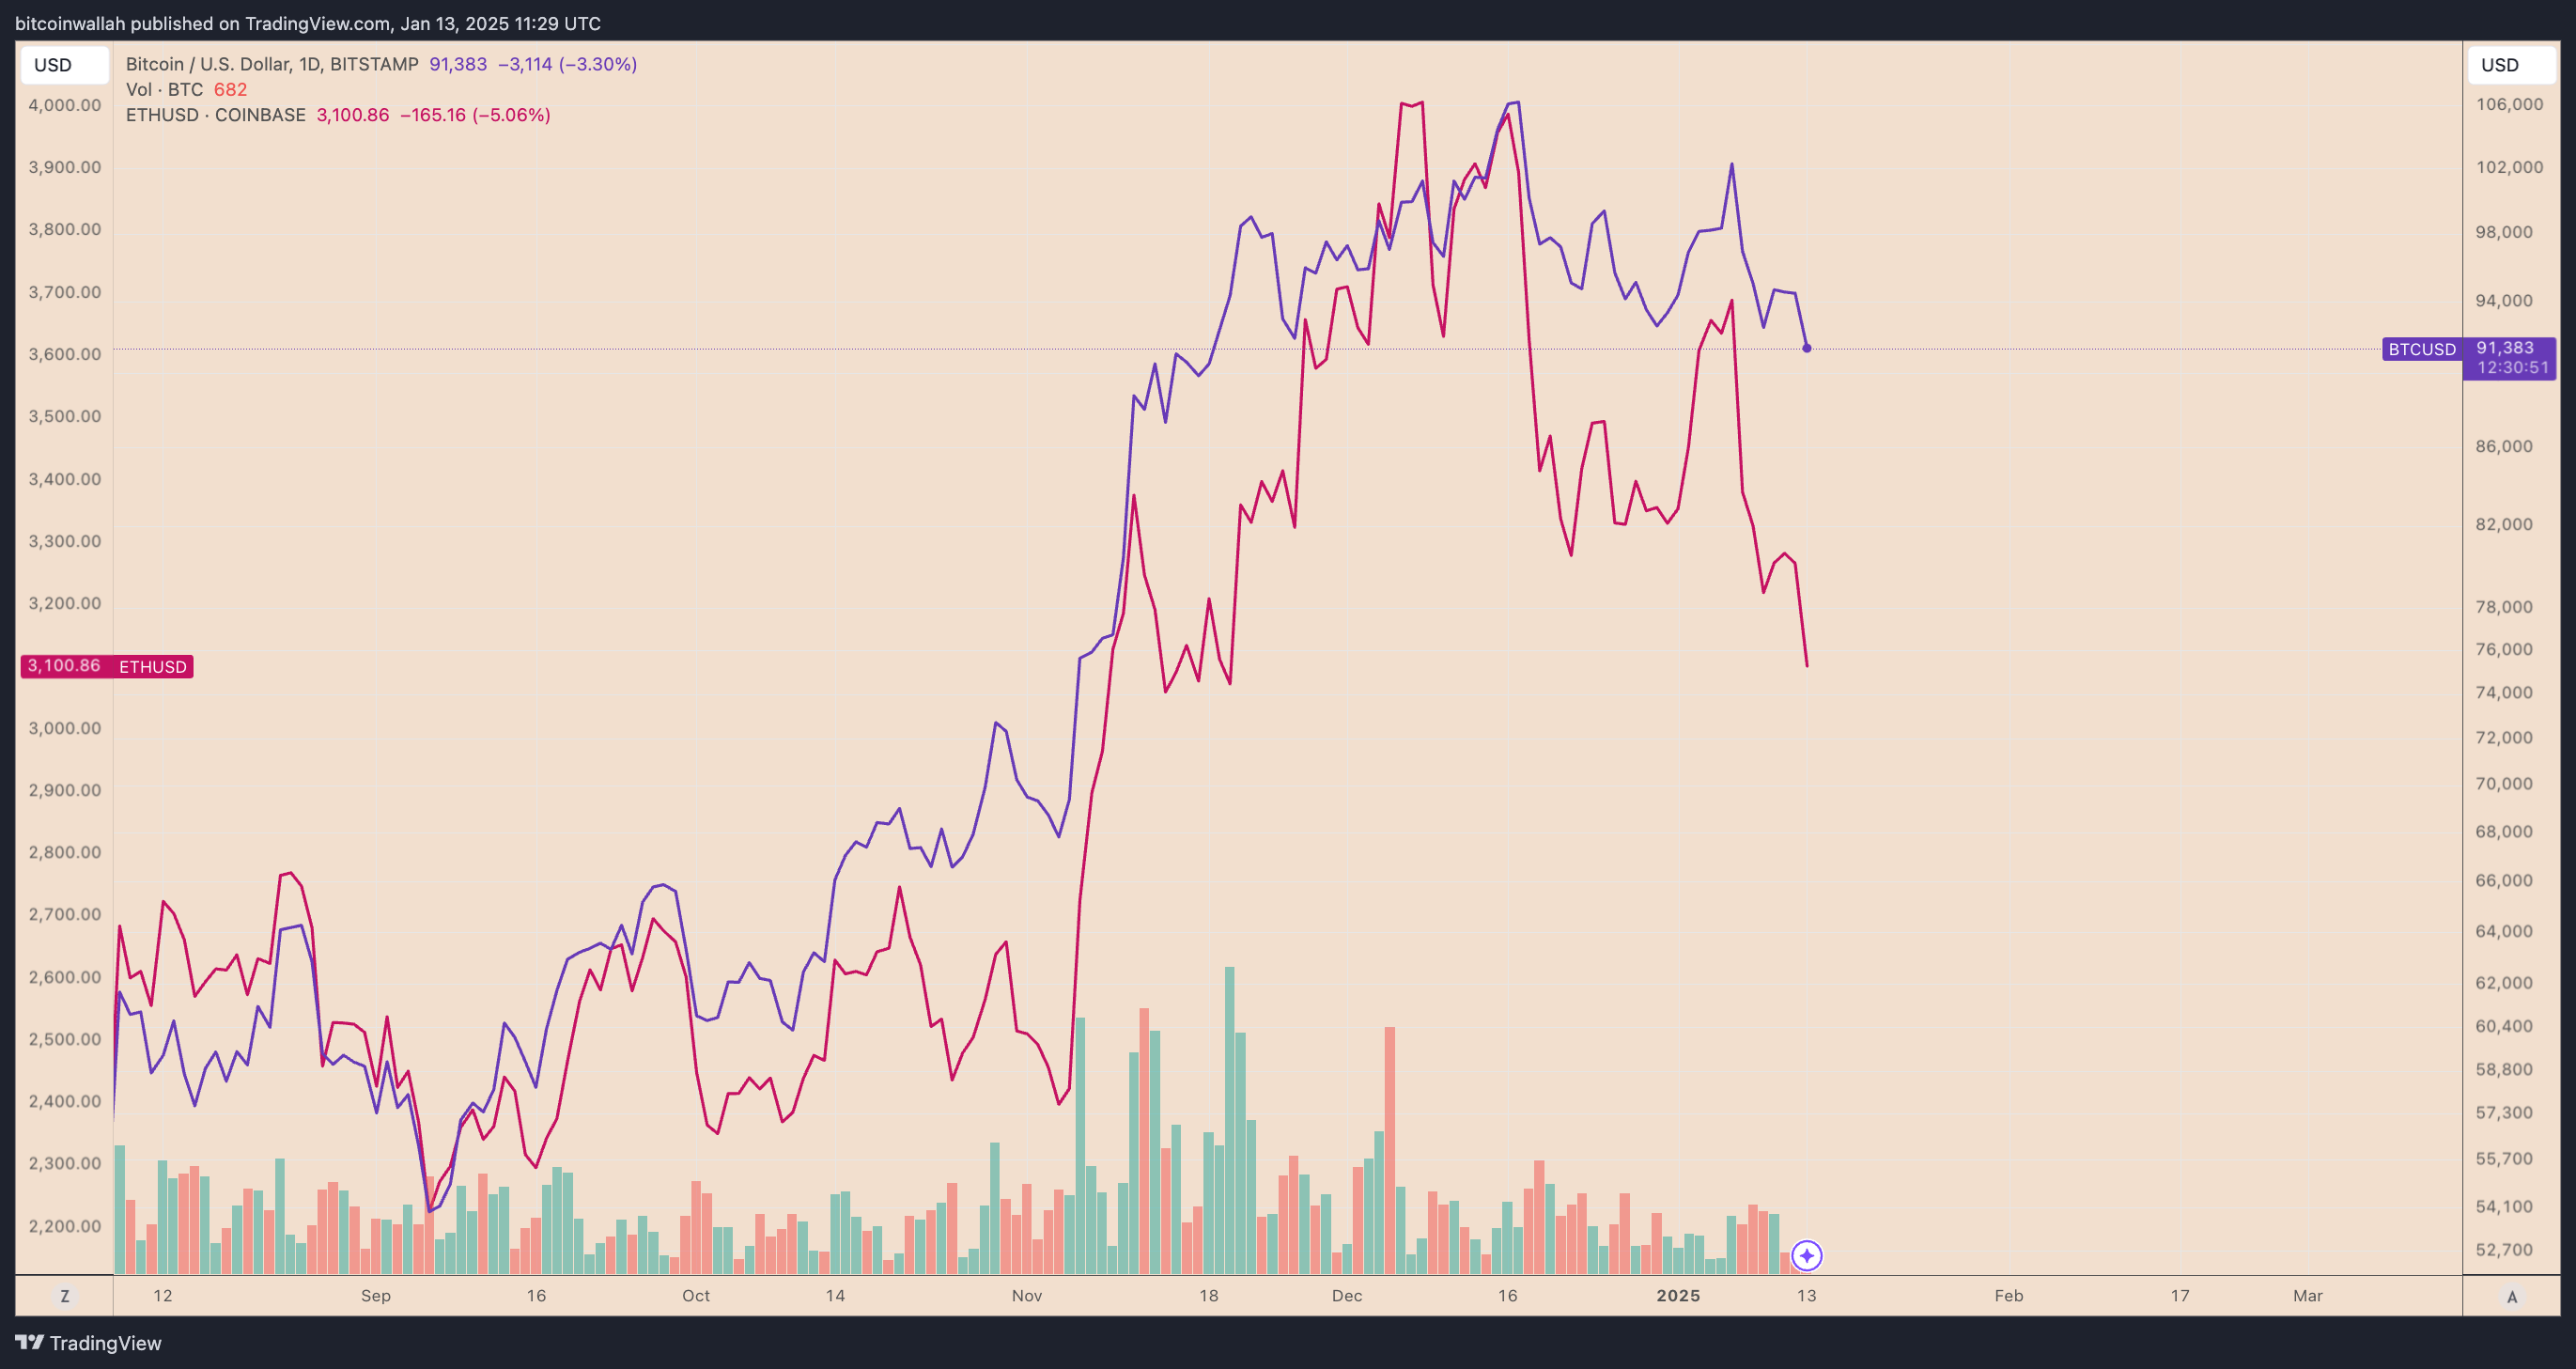
As of Jan. 13, Bitcoin had declined by more than 3% to reach an intraday low of $91,245. Meanwhile, Ethereum was down by approximately 5%, trading for as low as $3,105.

Key Points to Focus On
Here’s the series of events that have caused sharp declines in Bitcoin, Ethereum, and the broader crypto market recently.
- Global markets, already grappling with persistent turbulence in 2025, faced renewed pressure on Jan. 10 after a stronger-than-expected US jobs report and rising inflation expectations shook investor confidence.
- The data prompted traders to drastically scale back their bets on Federal Reserve interest rate cuts, with expectations now falling to less than 30 basis points for 2025.
- The fallout was swift: the S&P 500 erased its year-to-date gains, while the US Dollar Spot Index surged to a two-year high, underscoring the dollar’s dominance amid heightened uncertainty.
- Meanwhile, an additional oil price surge further exacerbated inflation concerns, amplifying fears of prolonged monetary tightening.
- These developments have deepened concerns about the Fed’s policy trajectory and its impact on both equity and cryptocurrency markets.
- The benchmark 10-year Treasury yield, a key indicator of global borrowing costs, climbed to a 14-month high, reflecting the growing opportunity cost of holding yielding assets compared to riskier assets like Bitcoin and Ethereum.
- Meanwhile, 30-year yields edged closer to the critical 5% mark.
Key US Inflation Data Might Rattle Bitcoin, Ethereum Bulls Further
Key inflation data set to be released on Jan. 14 and 15 — the Consumer Price Index (CPI) and Producer Price Index (PPI) reports — are poised to shape market sentiment ahead of the Federal Reserve’s policy meeting on Jan. 28-29.
According to the University of Michigan’s preliminary January survey, long-term inflation expectations among Americans have risen to 3.3% annually over the next five to 10 years, up from 3% in December.
Short-term inflation expectations have also jumped. Consumers forecast a 3.3% rise in costs over the next year, a sharp 0.5 percentage point increase from the previous month.
Bitcoin Price Forecast
Every new Bitcoin analysis as it publishes, today's technical signal and key levels, live price — on one page.
See all Bitcoin forecasts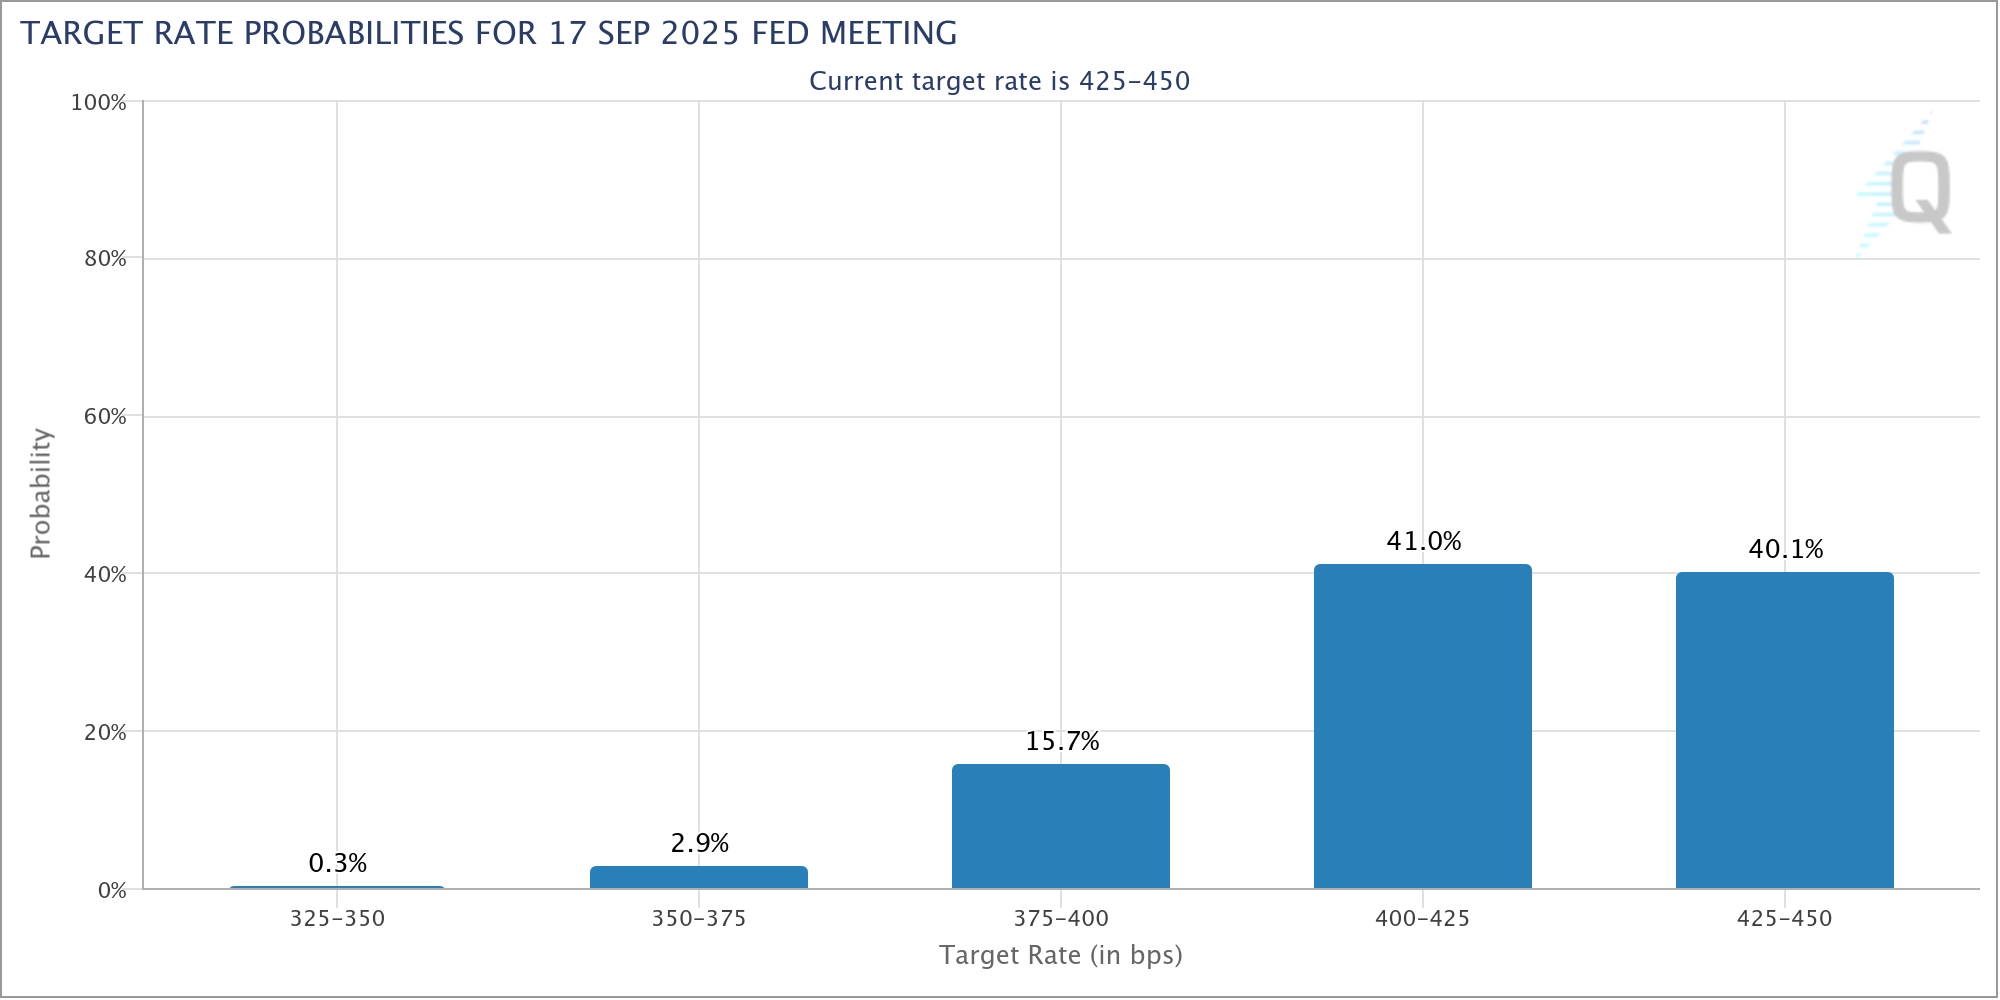
Bitcoin, Ethereum Technical Four-Hour Price Chart Technical Analysis
BTC Price Eyes $85,600 Next
Bitcoin is breaking out of a “bear pennant.” The setup, visible on the 4-hour chart, follows a sharp downside move earlier this month, suggesting that the current price action could lead to further losses in the short term.
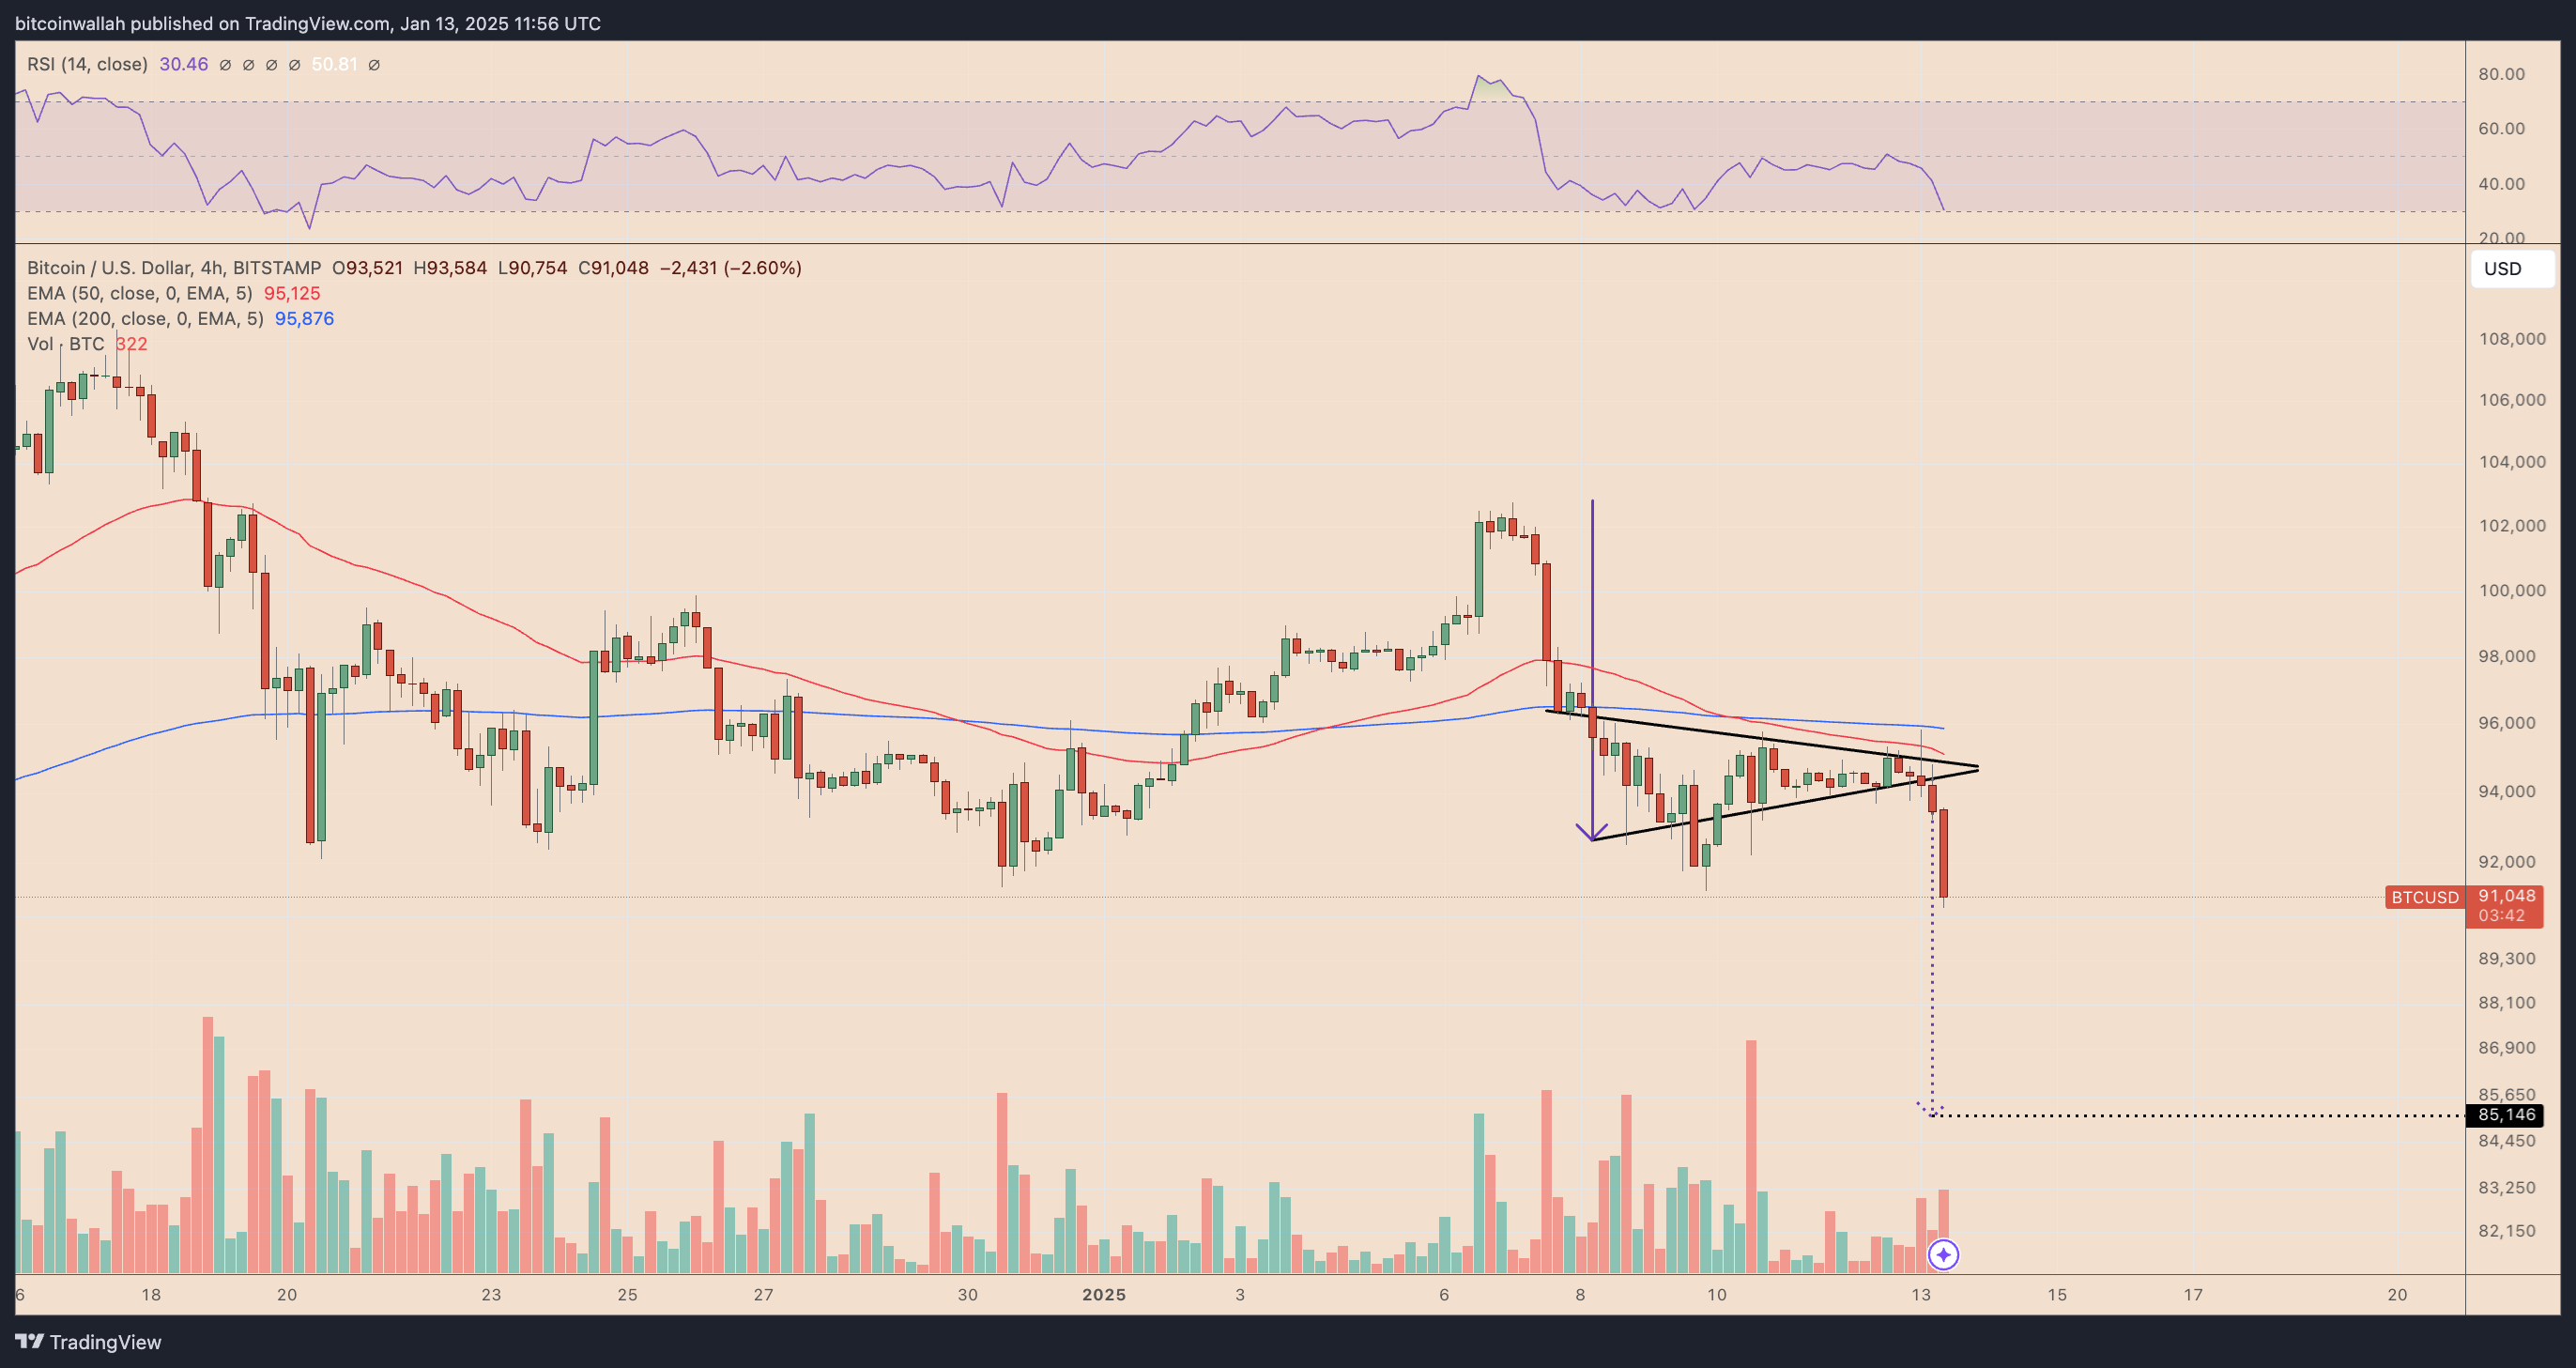
The pennant’s technical target is derived by projecting the height of the prior flagpole (the sharp drop preceding the consolidation) downward from the breakout point. Based on this calculation, Bitcoin risks a further decline toward the $85,600 level, coinciding with a major support zone from late 2022.
Several bearish indicators align with the pennant breakdown. For instance, Bitcoin remains below its 50- and 200-period exponential moving averages (EMAs), which act as dynamic resistance levels.
The 50-EMA has also recently crossed below the 200-EMA, forming a “death cross,” a classic bearish signal that typically predicts continued downside momentum.
Conversely, Bitcoin’s Relative Strength Index (RSI) on the 4-hour chart has dropped below 30, entering oversold territory. This suggests that the current downside momentum may be overstretched, potentially paving the way for a short-term relief rally.
Key levels to watch on the upside include the $92,000-$94,000 range, where the pennant’s former support line and the 50-EMA could now act as resistance. A reclaim of this zone would indicate a weakening bearish momentum.
ETH Price Could Drop Toward $2,760
Ethereum is following Bitcoin’s lead on Jan. 13, breaking below the lower trendline of its bear pennant pattern on the 4-hour chart. The bearish continuation setup formed after ETH’s sharp decline earlier this month, and the subsequent breakdown suggests the potential for further downside.
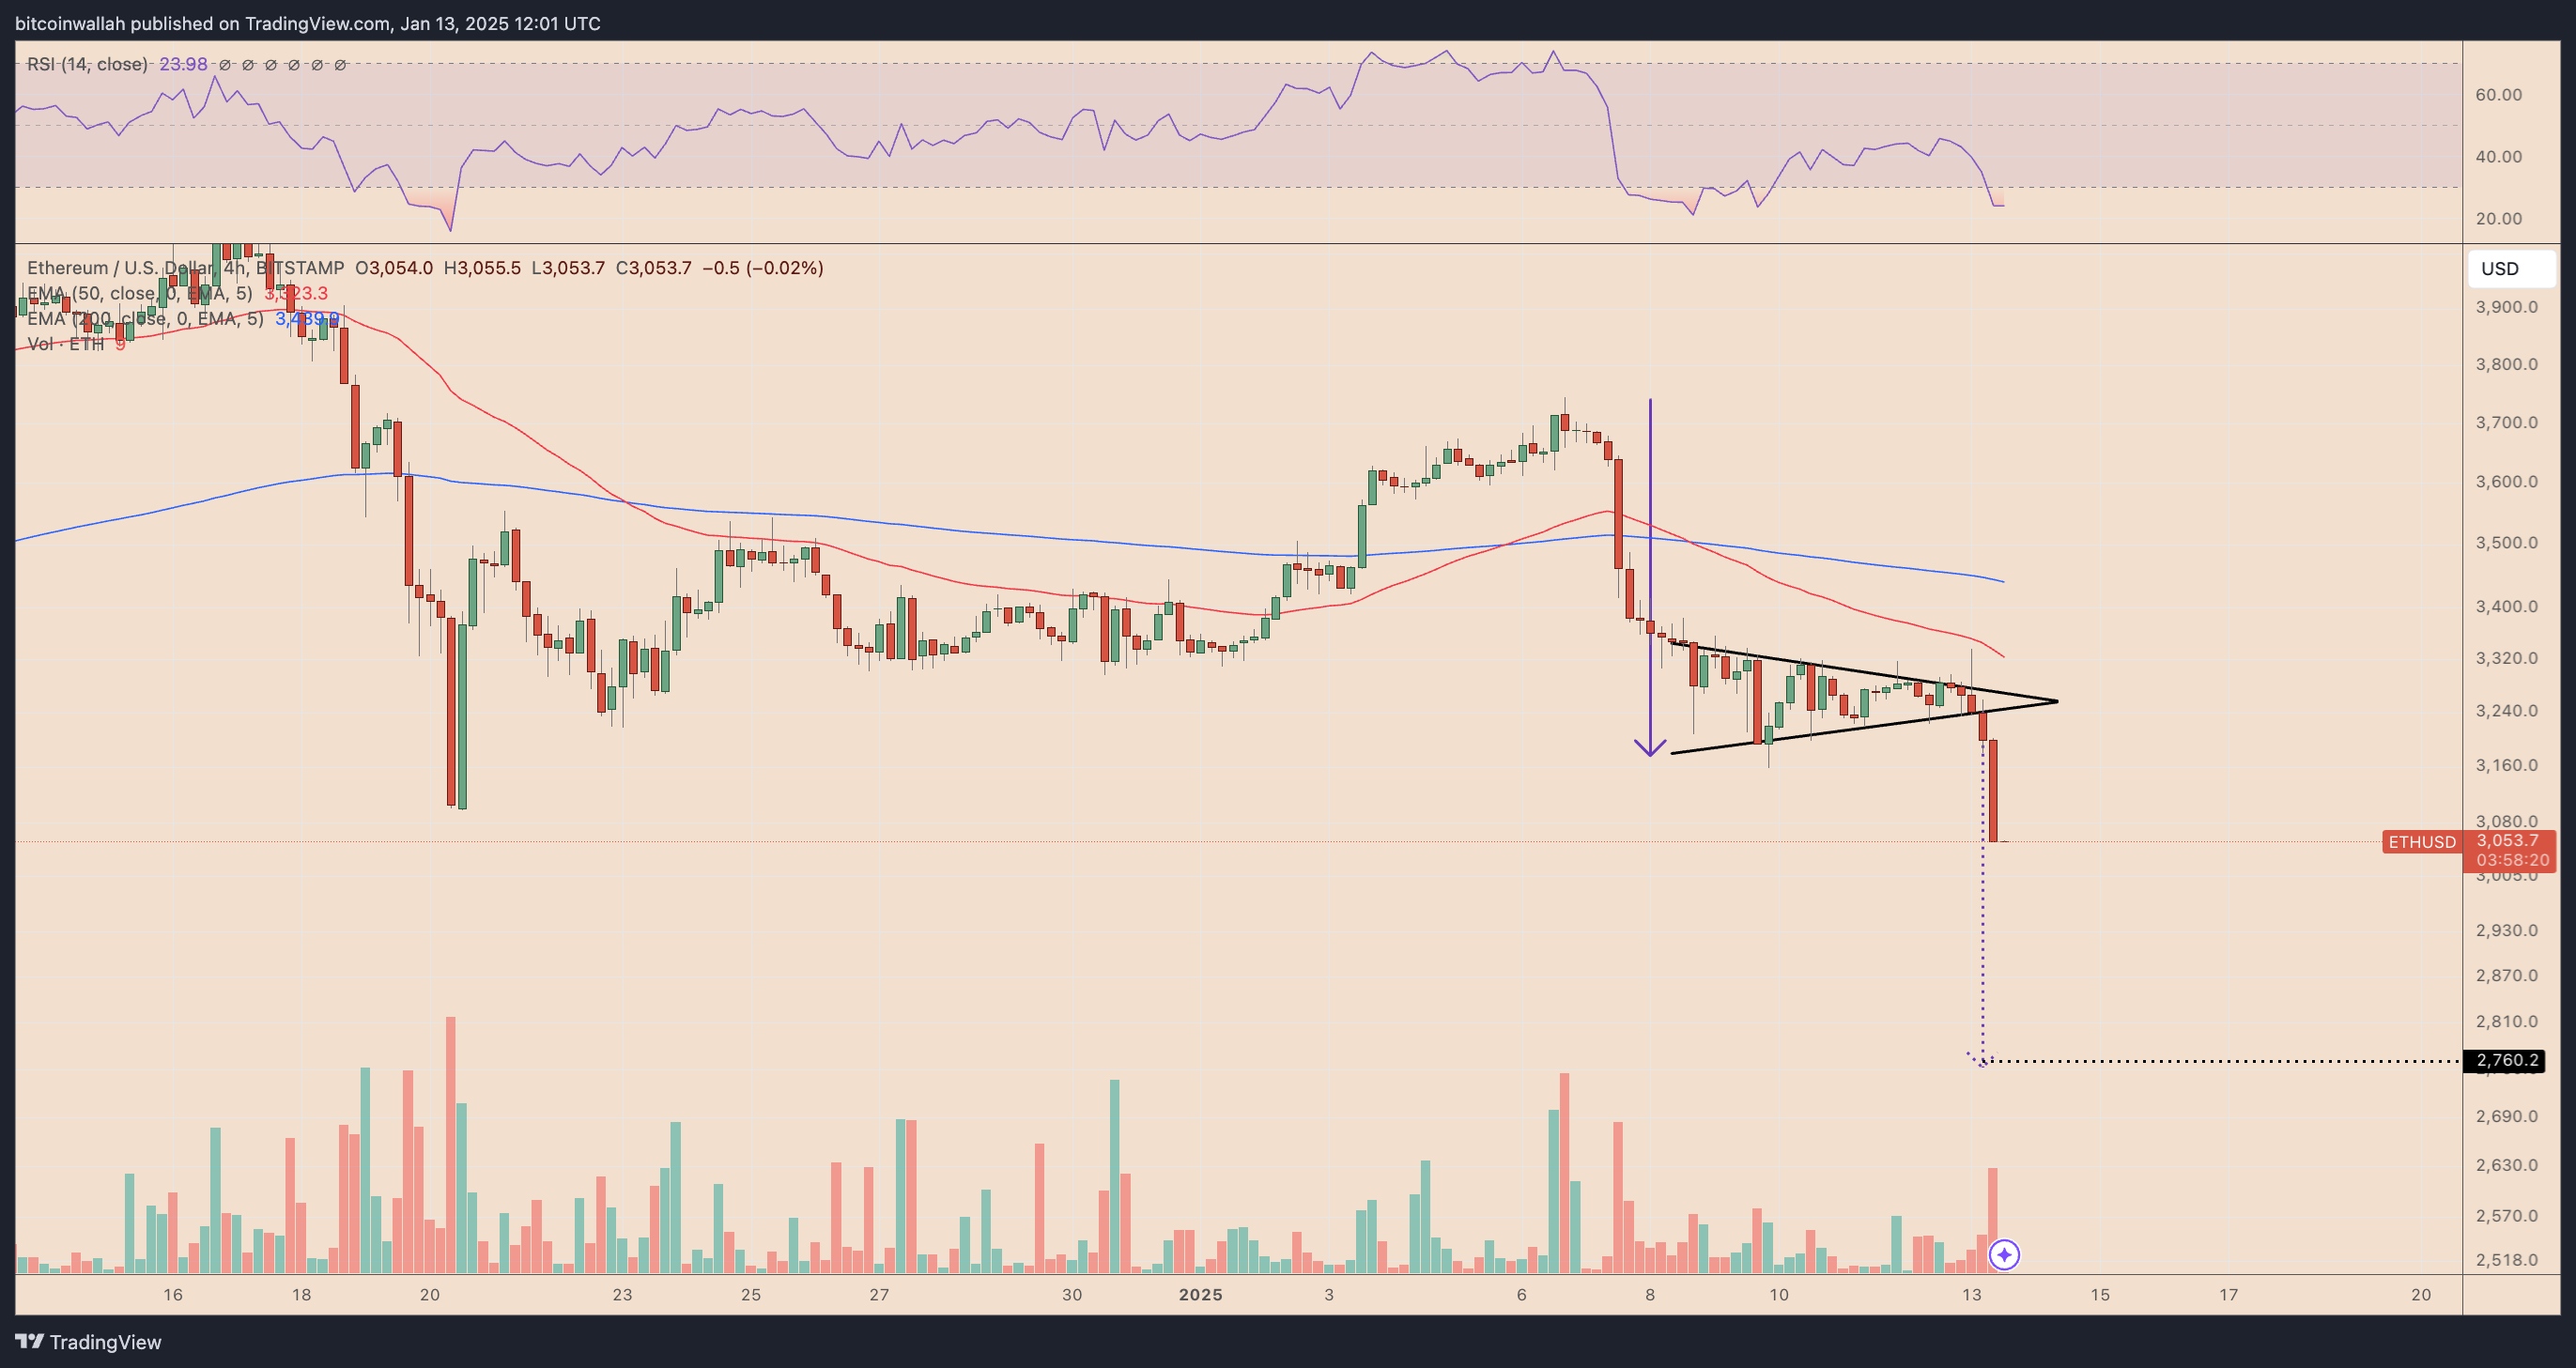
The measured move for the bear pennant points to a price target near $2,760, aligning with a critical support zone established in late 2022. The breakout occurred with an uptick in trading volume, validating the pattern’s bearish implications.
Additionally, Ethereum remains well below its 50- and 200-period exponential moving averages, which continue to act as overhead resistance levels, reinforcing the downtrend.
Conversely, Ethereum’s RSI has dropped below 24, indicating deeply oversold conditions in the 4-hour timeframe. Such extreme RSI levels have historically preceded relief rallies as buyers step in to defend key psychological levels.
Immediate support lies near $3,000, with $2,900 as the next critical floor. A strong defense of these levels could spark a short-term rebound, potentially pushing ETH toward $3,200-$3,300, where the pennant’s former support line and the 50-EMA converge.