NASDAQ 100 Technical Analysis
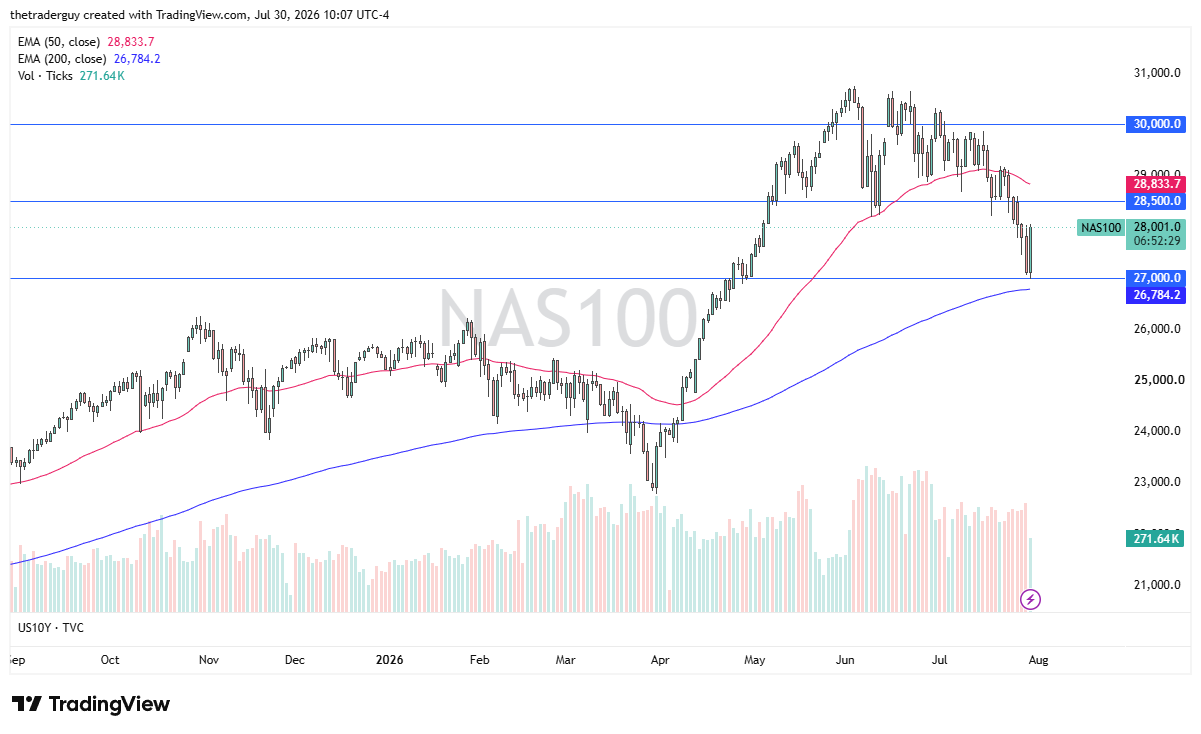
The Nasdaq 100 bounced a bit during early trading on Thursday as the 27,000 level has offered a bit of a floor. The question at this point in time is whether or not we can continue the momentum that we had seen previously. Ultimately, I think this is a market that is going to continue to be noisy, but it is worth noting that we have also just gotten pretty close to the 200-day EMA, so a technical bounce did make a certain amount of sense.

Dow Jones 30 Technical Analysis
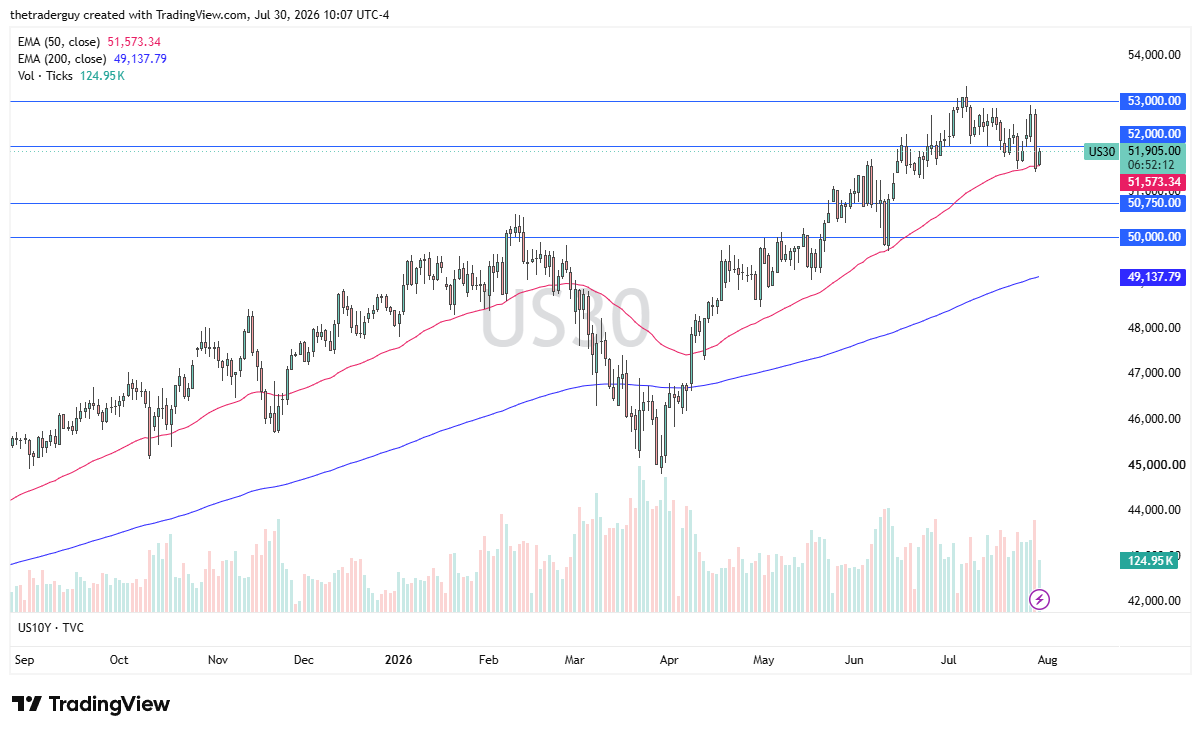
The Dow Jones 30 is trying to bounce from the 50-day EMA, and so far on Thursday it is doing so in the premarket. The 52,000 level would be an area that people will be watching fairly closely, as it had previously been significant support and resistance. Market memory suggests that it will do something. We’ll have to wait and see whether or not that holds up. Pretty ugly day on Wednesday, but the Federal Reserve interest rate decision days can often be noisy and even wrong as far as what the direction is, so I keep an open mind with this one.
S&P 500 Technical Analysis
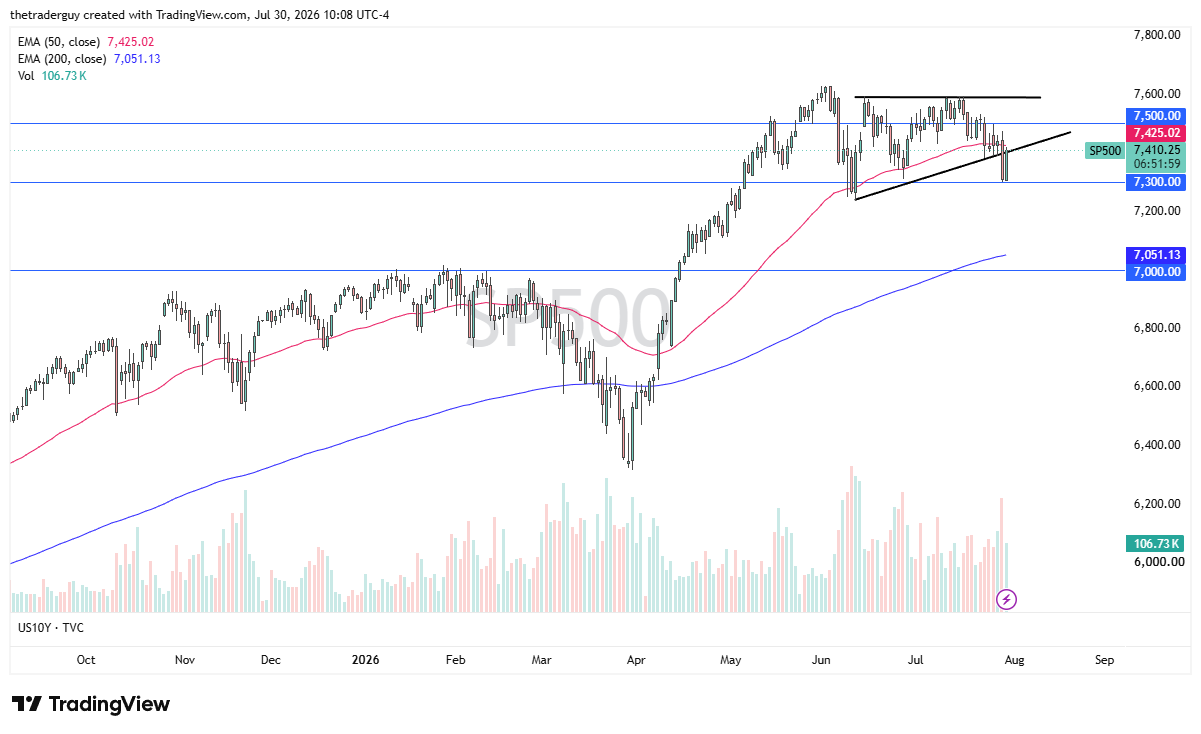
The S&P 500 fell pretty hard on Wednesday. Thursday looks like it is trying to recover. This is interesting for me because we had been forming an ascending triangle, and the ascending triangle, of course, got broken during the Wednesday session. So now, we have to ask: are we just forming a rectangle? That would just be a continuation of most of what we’ve been doing since summer started in North America.
So really at this point in time, it looks like the 7,300 level is offering support. The question is: can we break through the previous uptrend line on the ascending triangle without any issues? If we can, then that’s a good sign. Today could be very interesting for the S&P 500. Certainly, it looks like it is trying to come roaring back.
If you’d like to know more about technical analysis and how traders use it, please visit our educational area.