Flag Breakout Brings 2021 High Into Focus
The SPDR S&P Biotech ETF (XBI) has continued to show strength recently, advancing to a new trend high last week and again this week. Last week’s advance was accompanied by the highest weekly volume reading in eight weeks, showing broad participation. After last week’s new high a small three-day bullish flag pattern followed with support and a higher swing low forming at $161.49. If XBI stays above it, the bias remains to the upside. The breakout from this short consolidation now puts the 2021 peak directly in focus.
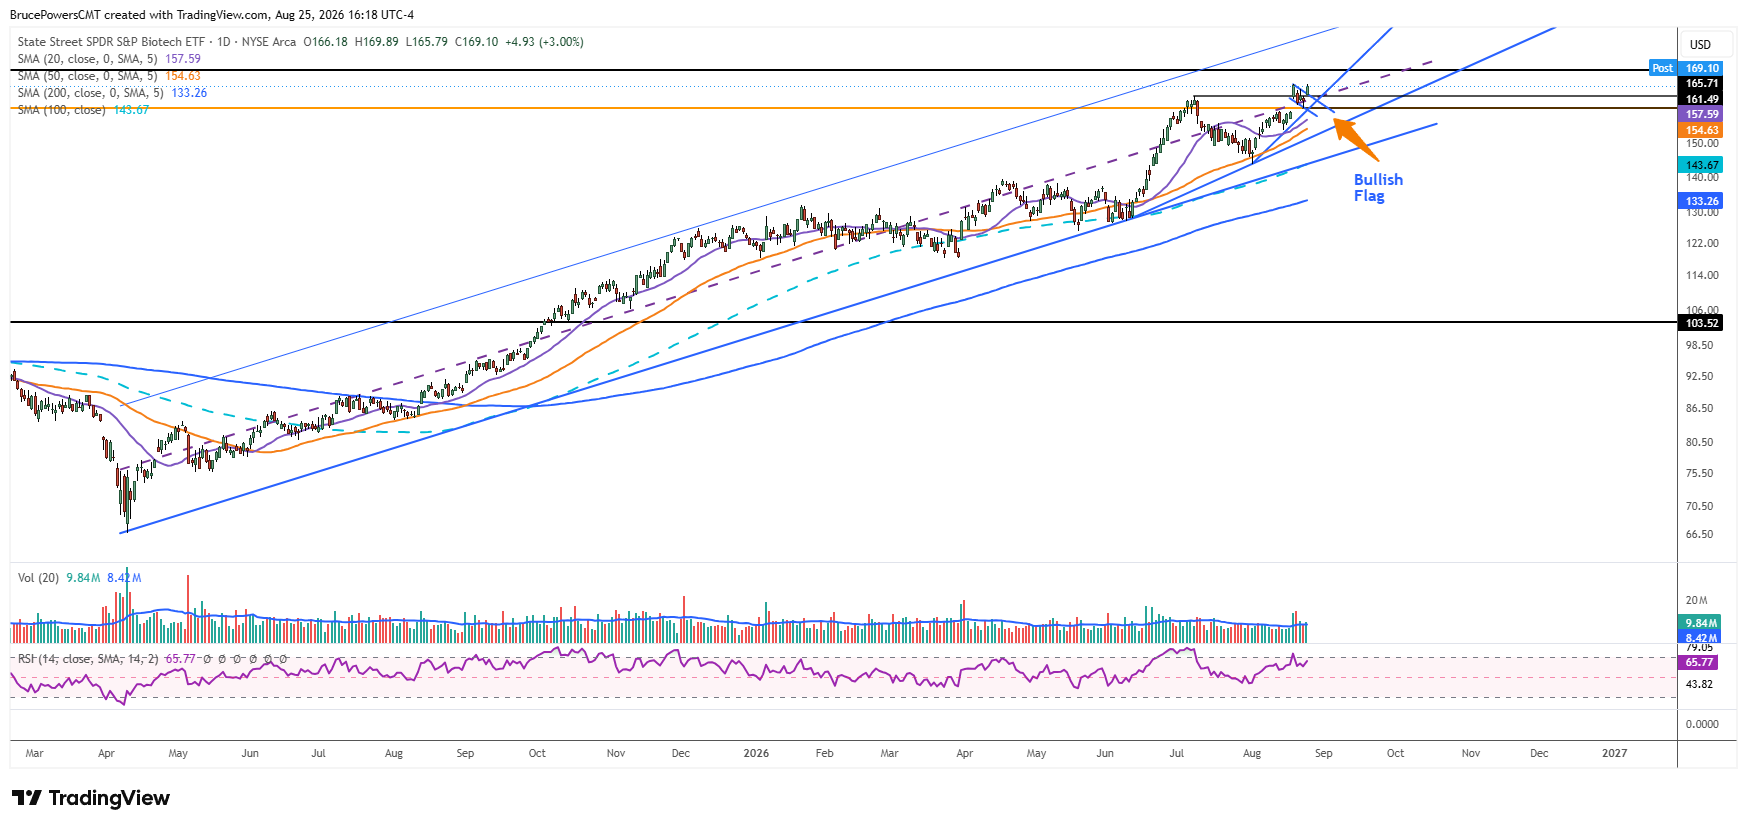
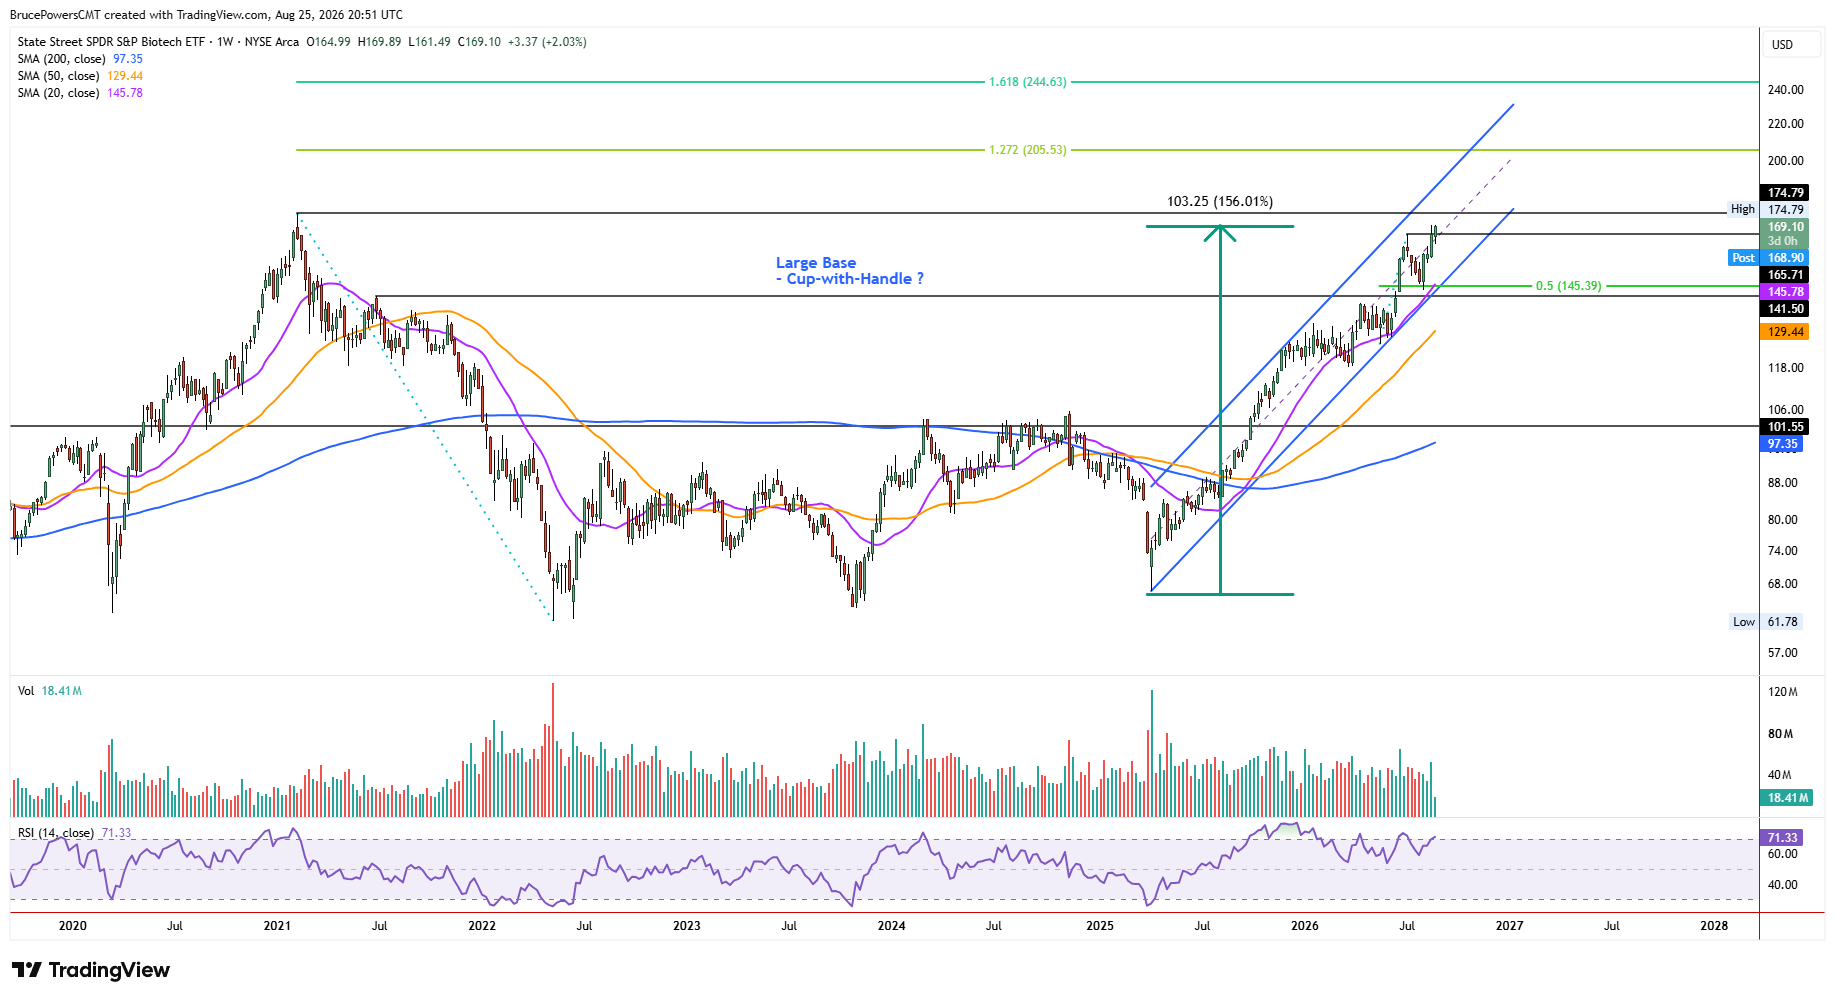
On Tuesday, a breakout from that small flag pattern triggered, with XBI reaching a new trend high of $169.89 thereby establishing a higher weekly high while retaining the higher low of $161.49. This put XBI on track to test resistance near the 2021 peak of $174.79. Since that high, XBI has traced out a large basing pattern where the right side of the base is close to matching the left side.
This leaves open the possibility that the handle portion of a large cup-with-handle basing pattern could develop if resistance is persistent near the 2021 price zone. A failure to break through that resistance could therefore provide the consolidation needed to form a handle, while a decisive breakout would signal that buyers are willing to push the ETF directly into new territory.

Powerful Advance Raises Overextension Risk
Having said that, the current bullish trend, which began from the swing low of $66.66 in April 2025, was up by around 155% as of Tuesday’s new trend high. That is a relatively sharp advance in just 16 months and raises concern that the trend could become overextended, as it approaches a potentially significant resistance zone. At the same time, if the uptrend can extend above $174.79, XBI may continue to advance before a consolidation that could lead to a handle formation. The strength of the advance therefore creates two competing possibilities: either a breakout that extends the rally or resistance that forces a period of consolidation.
$174.79 Becomes Decision Point
Nevertheless, XBI is setting up for a potential long-term base breakout that could see it continue to progress higher. The formation of a handle during a consolidation and a pullback, however, would keep the advance from getting too extended and therefore reduce the risk of the rally becoming due for a more decisive pullback. For now, $174.79 is the key level that could help resolve the uncertainty.