Gold showed strength today, rising to test resistance around the 20-Day MA with the day’s high of 2,342, at the time of this writing. That is an eight-day high for which it traded within a relatively tight range. Today’s high generates a new high for the consolidation range. Although it is a sign of short-term strength, it doesn’t change the near-term outlook. A daily close above the 20-Day MA at 2,335 would begin to do that. Also, after today’s session, a daily close above today’s high would also be a sign of strength that may lead to increased demand.
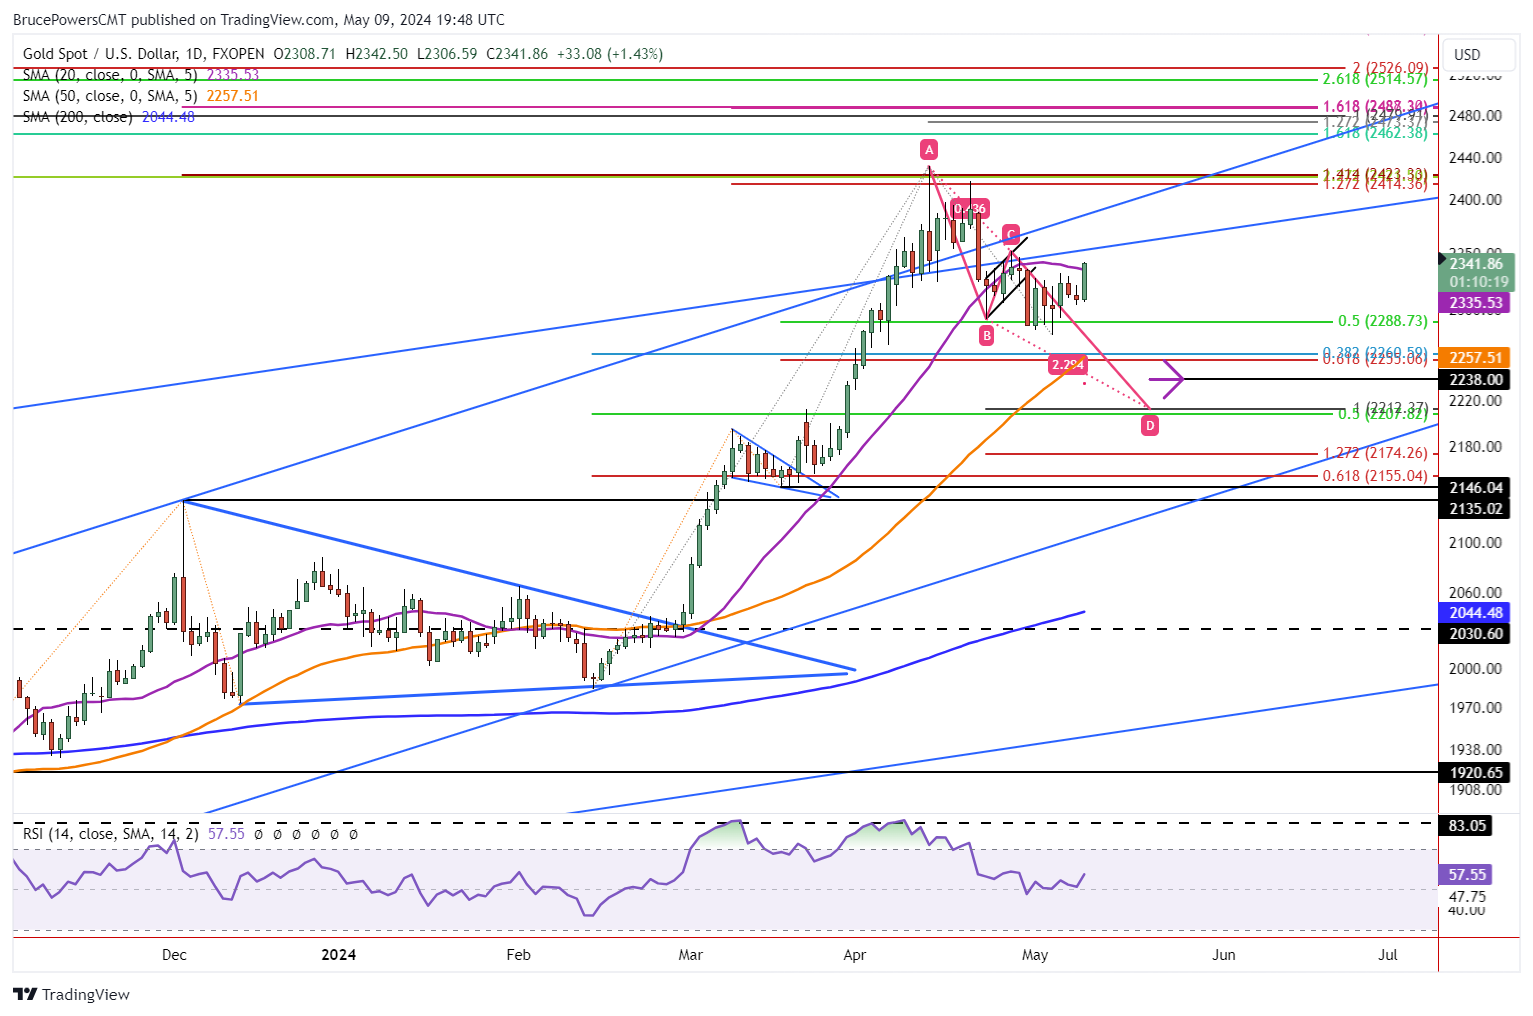

Testing Resistance
So, what happens next will be of interest. If gold moves above today’s high (also 20-Day MA), then higher prices may follow. But if today’s resistance holds and is followed by a pullback, a continuation of the retracement remains in play. Last week’s high of 2,347 is also an important near-term price level as a rally above it will trigger a bullish reversal in the weekly time frame. Currently, gold is set to complete this week as an inside week.
Therefore, starting next week a breakout above this week’s high would provide a bullish signal, keeping in mind that such a move would also exceed resistance around the 20-Day line. Buyers have regained control of silver following today’s rally above its 20-Day MA. This might be a warning that gold could be about to do the same. Price action will provide a guide.
Watching for Signs of Strength
Potential lower targets have been discussed in recent articles, so today let’s consider the upside potential. A decisive breakout above last week’s high of 2,347 will provide a bullish signal that could lead to higher prices, or above this week’s high once the week completes. Additional strength will be indicated on a rally above the most recent swing high on the daily chart at 2,352 (C). Once there is a daily close above the slightly higher level, the chance for a sustained advance improves.
Minor Retracement Shows Underlying Strength
When considering the larger picture. Gold broke out of a multi-year basing pattern in March and kept going until reaching the current record high of 2,431. If last week’s low of 2,277 is the completion of a retracement, it would reflect strong underlying demand for gold as buyers stepped up before a 38.2% Fibonacci retracement completed.
For a look at all of today’s economic events, check out our economic calendar.