Support Holds After Record High
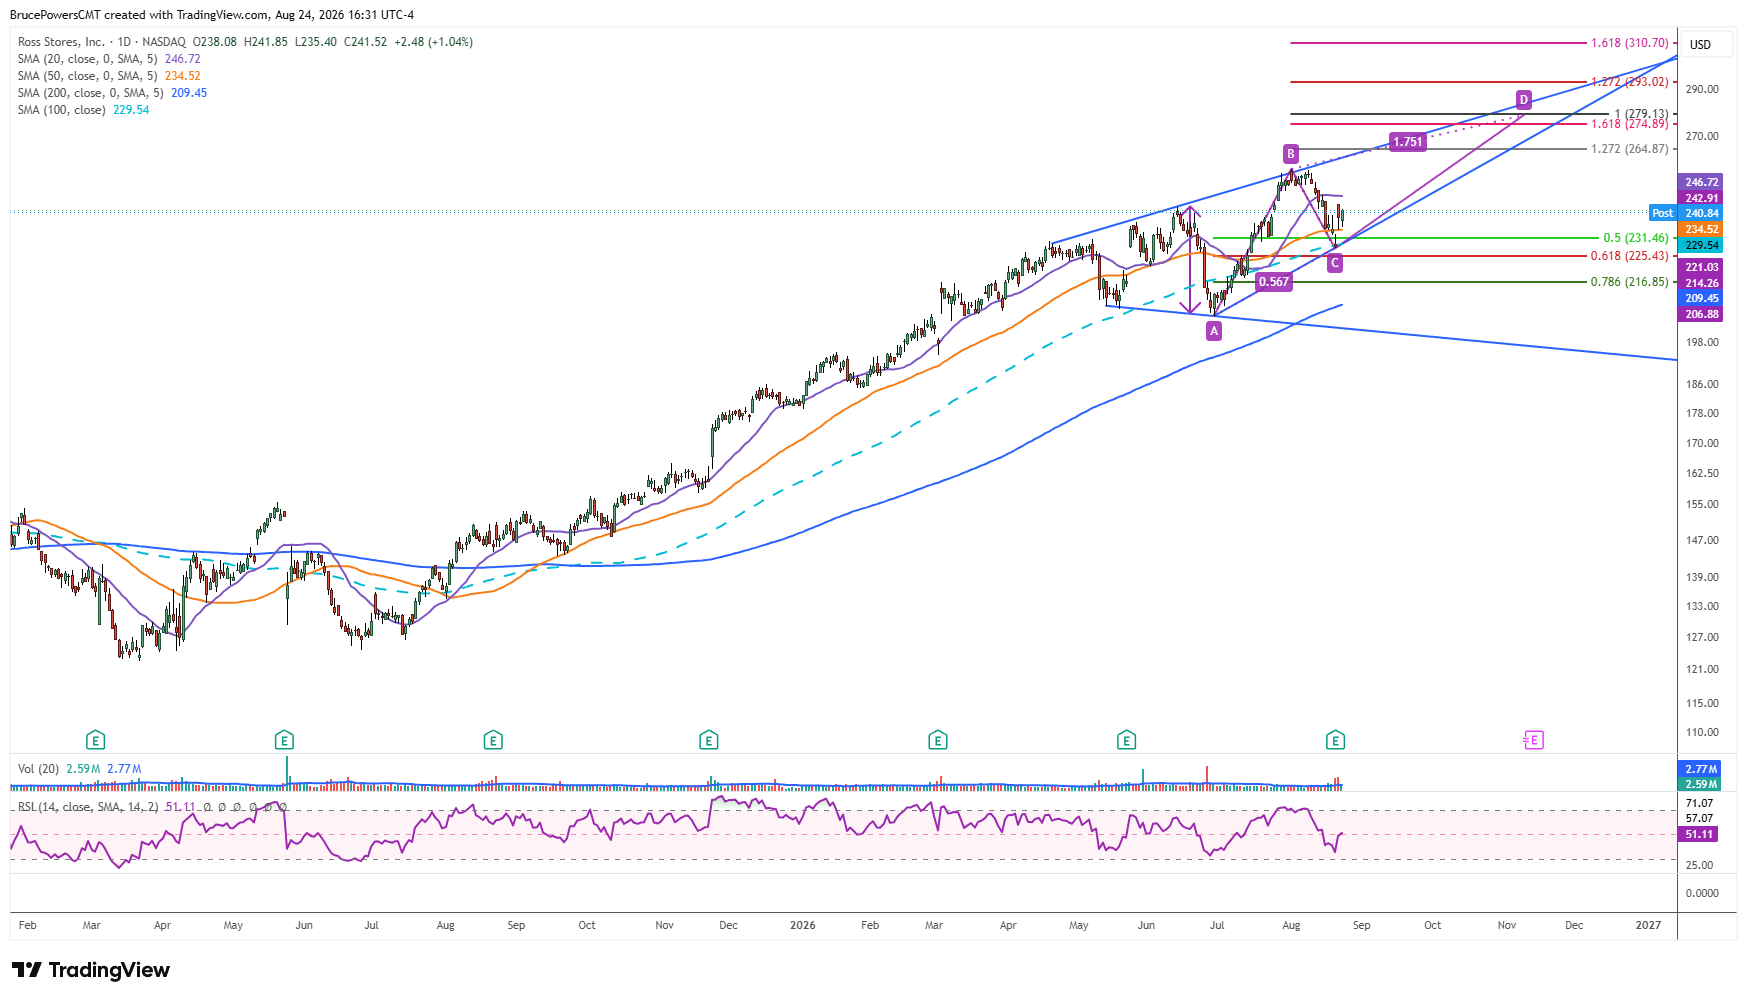
Ross Stores, Inc. (ROST), a U.S. off-price retailer, reported Q2 2026 results last Thursday. That led to a higher swing low of $228.05 for its stock and a successful test of support at the 100-day moving average and the 50-day moving average as well. Although that shorter average failed as support for one day, it was quickly reclaimed and successfully tested as support with the lows of Monday and last Friday. Moreover, the larger pattern within the weekly chart confirms the likely completion of the pullback following a new record high of $257.00 that was reached three weeks ago.
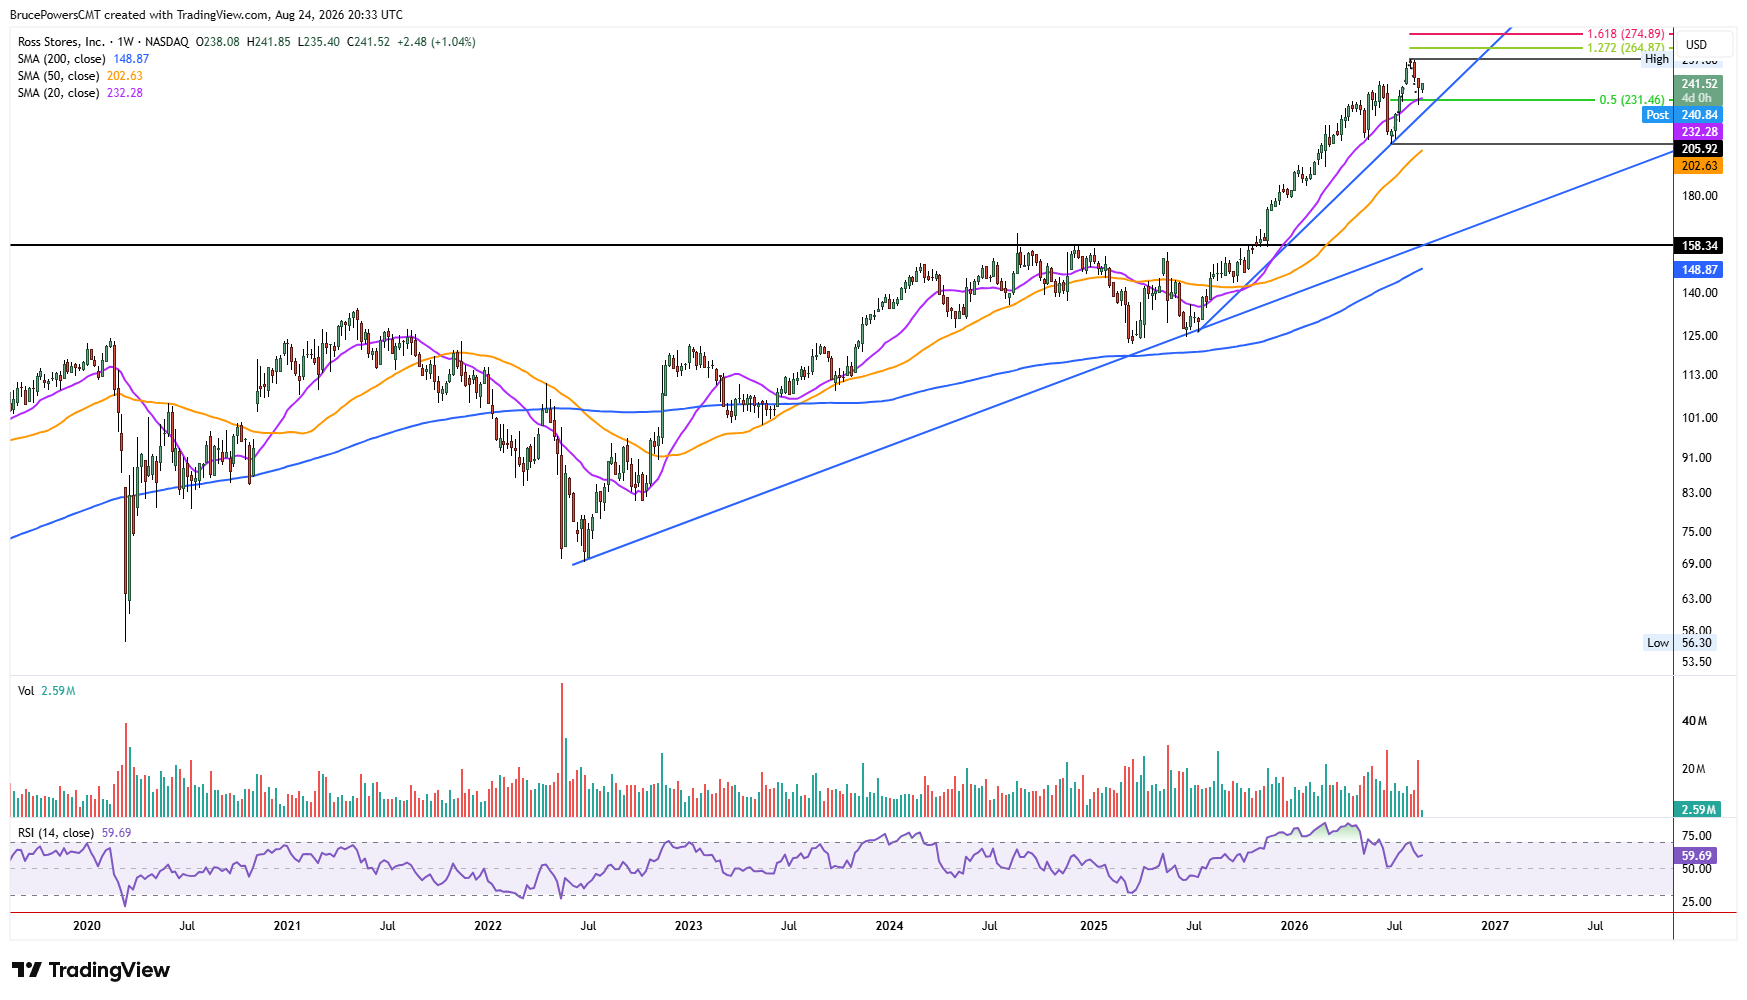
The weekly chart shows support being found during the pullback at the 20-week moving average, as it was during the pullback in May. Last week closed in the upper half of the period’s range following support near the 20-week average and established a bullish hammer candlestick pattern. Monday began the week inside last week’s range and given the magnitude of that range of $228.05 to $244.89, it wouldn’t be surprising to see ROST remain within the range this week before an attempt to rise above the $244.89 high is made.

Multiple Timeframes Strengthen Signal
Nonetheless, signs of the possible completion of the correction on multiple timeframes can increase the reliability of related signals. Alternatively, a decline below last week’s low would be bearish and confirm the failure of support and the likely continuation of the pullback to test lower support levels. One of the patterns present in the charts is that of a broadening formation. Therefore, the lower boundary line of the pattern would become a potential downside target if that low was triggered.
Upside Targets Extend Toward $279
An initial upside potential target is indicated by the 127.2% Fibonacci extension of the recent decline at $264.87. The 161.8% Fibonacci extension at $274.89 identifies a second upside target derived from the same swing. Also, a measured move target for a rising ABCD pattern is near $279.13.