Silver’s 10% Breakout Runs Into the 52-Week Moving Average
Spot silver gained 10.28% last week and closed at $63.56 after July payrolls contracted and the September rate-hike case collapsed. That is the strongest weekly performance of the year and it broke a range that had been holding since late June. The move forced short covering across the board and left the market pressing against the 52-week moving average at $65.53 early Monday.
The rally was a rate trade. Treasury yields dropped, the dollar weakened and the cost of holding silver fell in one session. Lower crude oil added a second tailwind by pulling inflation pressure out of the Fed debate. The question this week is whether CPI Wednesday and PPI Thursday confirm the repricing or reverse it. Silver ran 10% on one data point. The next two data points decide whether it holds.
As of 12:27 GMT Monday, August 10, spot silver was trading $63.80, up $0.24 or 0.38%. Last week’s range ran from $56.66 to $65.16.
Weekly Spot Silver (XAGUSD) Technical Analysis
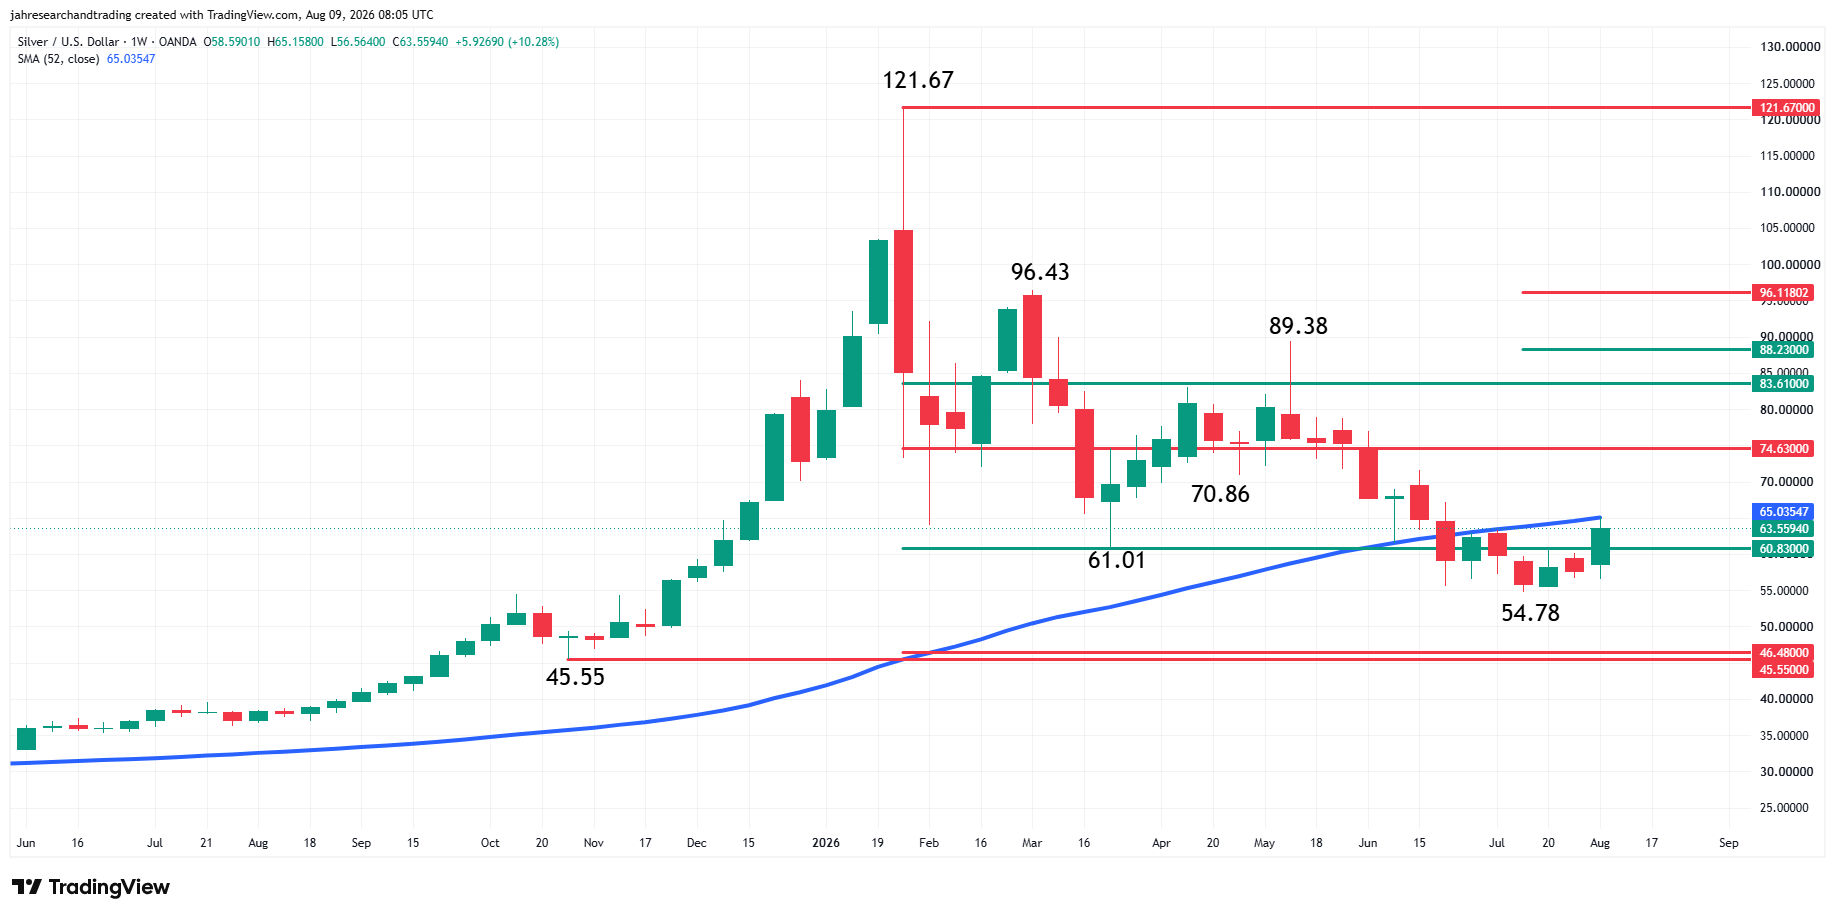
Spot silver is edging higher on Monday after surging last week to its highest level since the week ending June 26. The strong close also put the market within striking distance of the 52-week moving average at $65.53. Trader reaction to this indicator will determine whether buyers have enough strength to drive the market into Fibonacci resistance at $74.63, or whether sellers push it back to the weak side of the long-term 50% level at $60.83.
The main trend is down according to the weekly swing chart, so it will not be a complete surprise if sellers re-emerge. The nearest main top is $89.38. A trade through this level will change the main trend to up.
In my opinion, most of the buying on the weekly chart is related to value. The current bottom at $54.78 was formed inside the 50% to 61.8% retracement zone of the all-time high at $121.67. Those key retracement levels come in at $60.83 to $46.48.
To some traders, overcoming the 52-week moving average at $65.53 will signal a change in trend. Minor swing traders will look for a change in trend on a trade through $71.56.
Short-term traders could take the simple route this week. They have already seen support form just under the major long-term 50% level at $60.83. They have already seen the potentially bullish move to the strong side of this level and a close over it. Now they may be waiting for the next catalyst that either extends the rally over the 52-week moving average or pushes it back under the long-term 50% level.
Silver Price Forecast
Every new Silver analysis as it publishes, today's technical signal and key levels, live price — on one page.
See all Silver forecastsThe Payroll Miss Handed Silver Its Biggest Weekly Gain of 2026
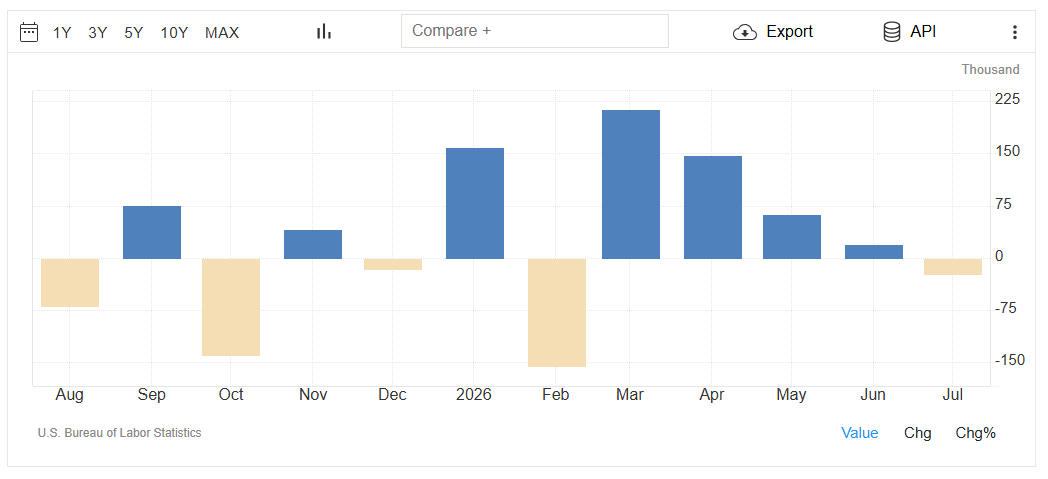
July payrolls came in at negative 23,000 against expectations for a solid gain. Prior months were revised lower. September hike odds dropped from 67% a week ago to about 44% and that single repricing drove silver from $56.66 to $65.16 in five sessions. The dollar gave back ground, yields fell and the shorts got run over.
Silver moved faster than gold at points during the week because it carries both the rate trade and the industrial trade. When hike odds fall, the monetary side of silver catches a bid. When growth expectations improve at the same time, the industrial side gets pulled along. Both happened last week and 10.28% was the result.
Crude Oil Helped by Getting Out of the Way
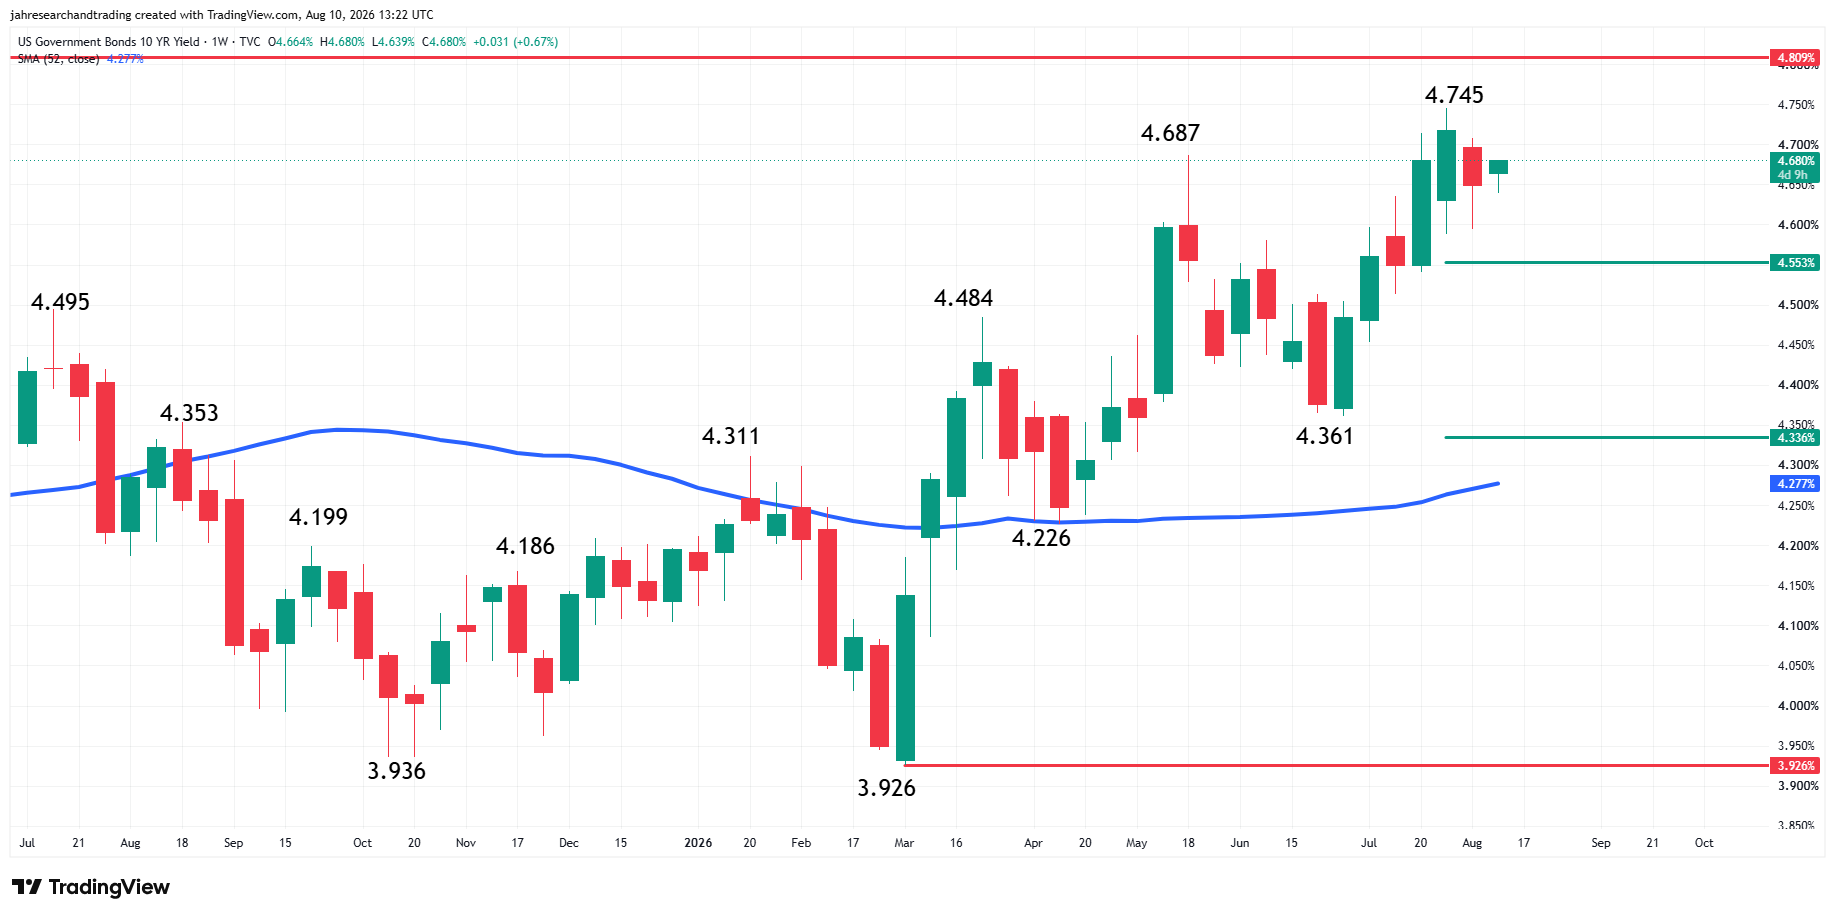
Oil dropped sharply last week on Hormuz deal expectations and that removed the energy cost pressure that had been feeding the inflation argument. Lower crude gave the Fed less reason to act on rates and silver priced that.
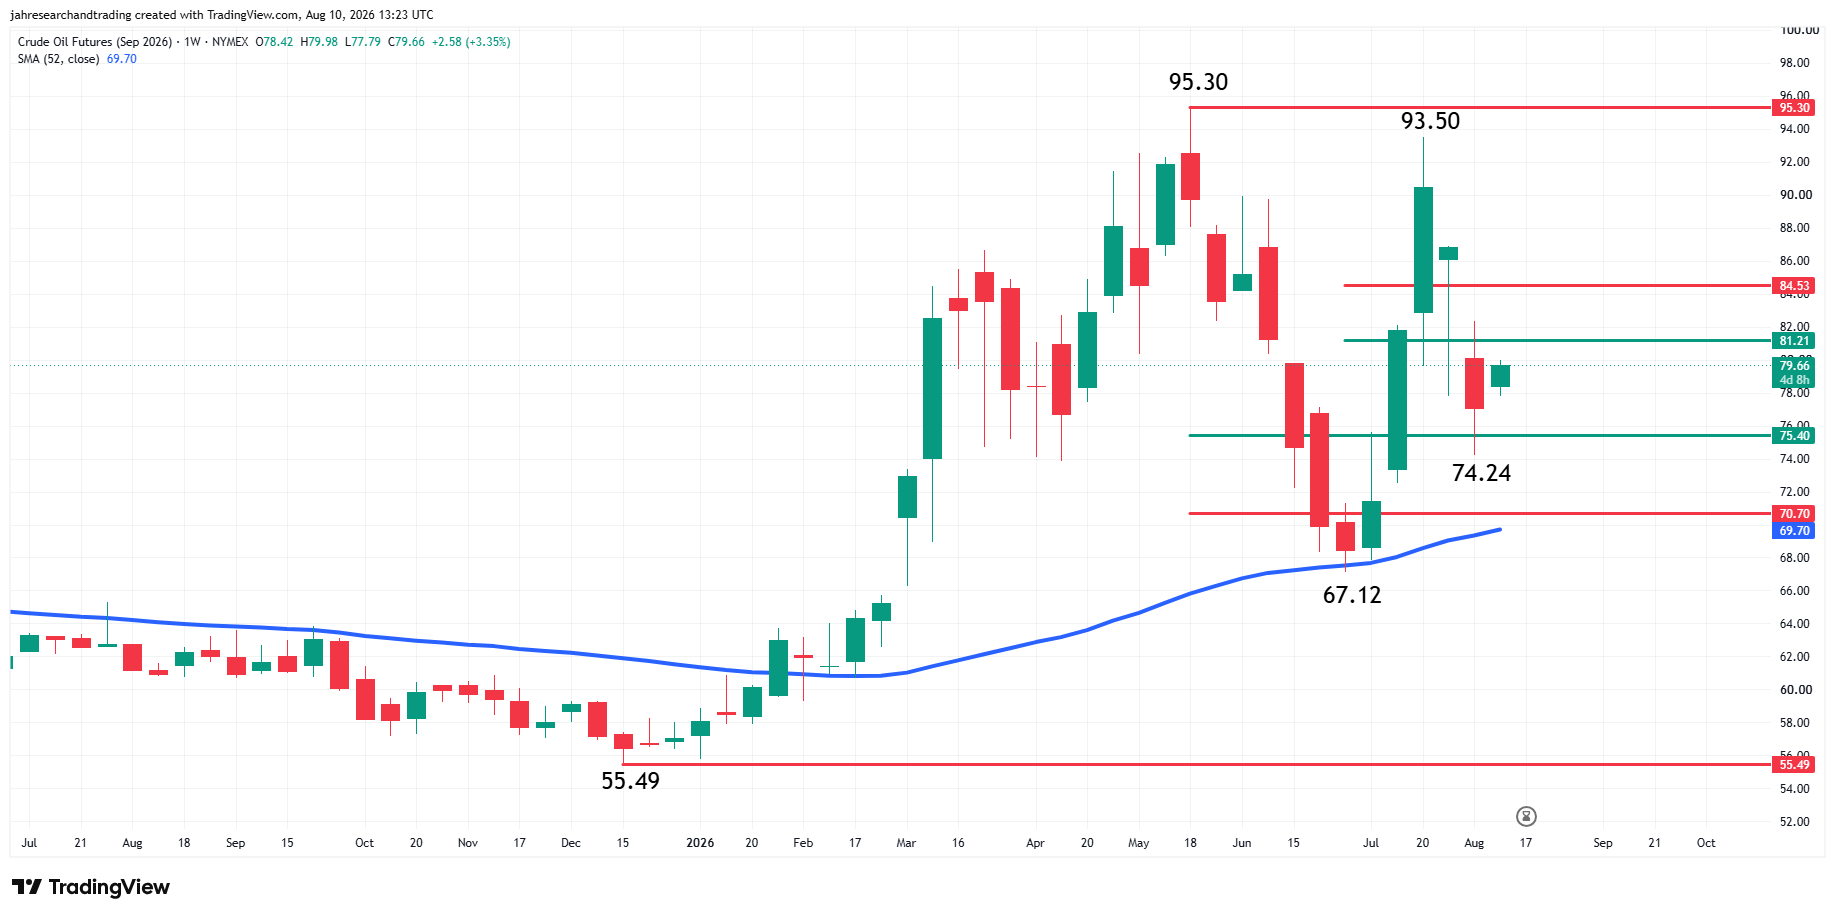
The complication is Monday’s tape. Iran denied direct negotiations over the weekend and WTI is back above $79. If crude keeps climbing, it rebuilds the inflation story and pushes rate-hike odds back up. Silver needs oil to stay lower this week or the rate relief that drove last week’s breakout starts unwinding.
CPI Wednesday Tells Silver Whether the Breakout Holds
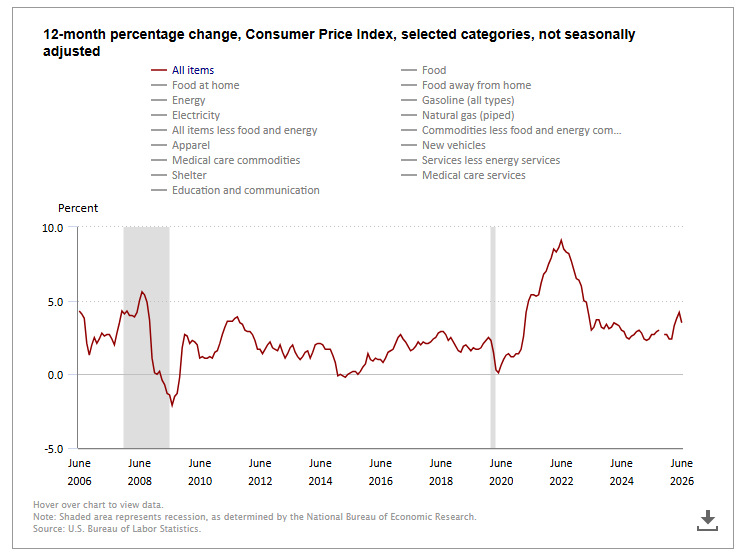
Headline CPI is expected at 3.4% year-over-year. Core at 2.5%. PPI follows Thursday. Retail sales close the week Friday. Silver just gained 10% on one payrolls print and now the inflation numbers either confirm or contradict what that print said about the Fed’s path.
A soft CPI keeps September hike odds falling and gives silver room to push through the 52-week moving average and run toward the Fibonacci resistance above it. A hot reading brings hike odds back, firms the dollar and puts the entire weekly gain at risk. Silver reacts fast to rate repricing in both directions. Last week proved that on the way up. This week can prove it on the way down just as quickly.
Hormuz Headlines Are the Wildcard That Can Override Everything
The Strait of Hormuz conflict has been in the background for months but it has not left. Friday’s Hormuz headlines moved crude, crude moved inflation expectations and inflation expectations moved the Fed outlook. That chain runs straight through silver.
Progress on a deal knocks oil lower and removes safe-haven demand. That creates a mixed trade for silver because the rate side benefits from lower oil but the risk side loses its bid. Escalation does the opposite. Oil spikes, inflation fears return and silver catches a defensive bid even if the dollar strengthens on the flight to safety. The conflict is a binary risk sitting over every session this week.
Weekly Forecast
Silver’s 10% gain was a rate trade first, an oil trade second and a geopolitical trade underneath. The breakout cleared months of range and left the market sitting just below the 52-week moving average at $65.53. That level is the week’s pivot. A push through it targets the Fibonacci resistance at $74.63 and signals that the base-building off the $54.78 low is producing a trend change. A rejection sends silver back toward the 50% support at $60.83.
CPI Wednesday and PPI Thursday carry the weight. Soft inflation numbers keep the rate repricing intact and give buyers the catalyst to challenge the moving average. Hot prints bring hike odds back and the same rate trade that powered last week’s rally works against silver just as fast. Oil back above $79 with Hormuz talks stalling adds pressure on the inflation side and makes Wednesday’s number even more important. Silver needs the data to cooperate this week or the breakout starts giving back ground.
More Information in our Economic Calendar.