
Ethereum Price Analysis:
Ethereum price rallied 27% from the weekly low of $2,100 before hitting a brick wall around $2,720 on Sunday, Aug 11, 3 market indicators suggest that ETH could start the coming week on the back foot.

Ethereum Price Fails to Flip $2,700 Sell-Wall
Ethereum’s recent price action has been a rollercoaster, especially following the market-wide crash on August 5. ETH initially showed resilience, bouncing back with a 27% rally from its lows.
This recovery was driven by several bullish news event around crypto regulations, including the approval of a Solana ETF in Brazil, a lenient fine on Ripply from the US SEC, and Russia’s move to legalize crypto mining.
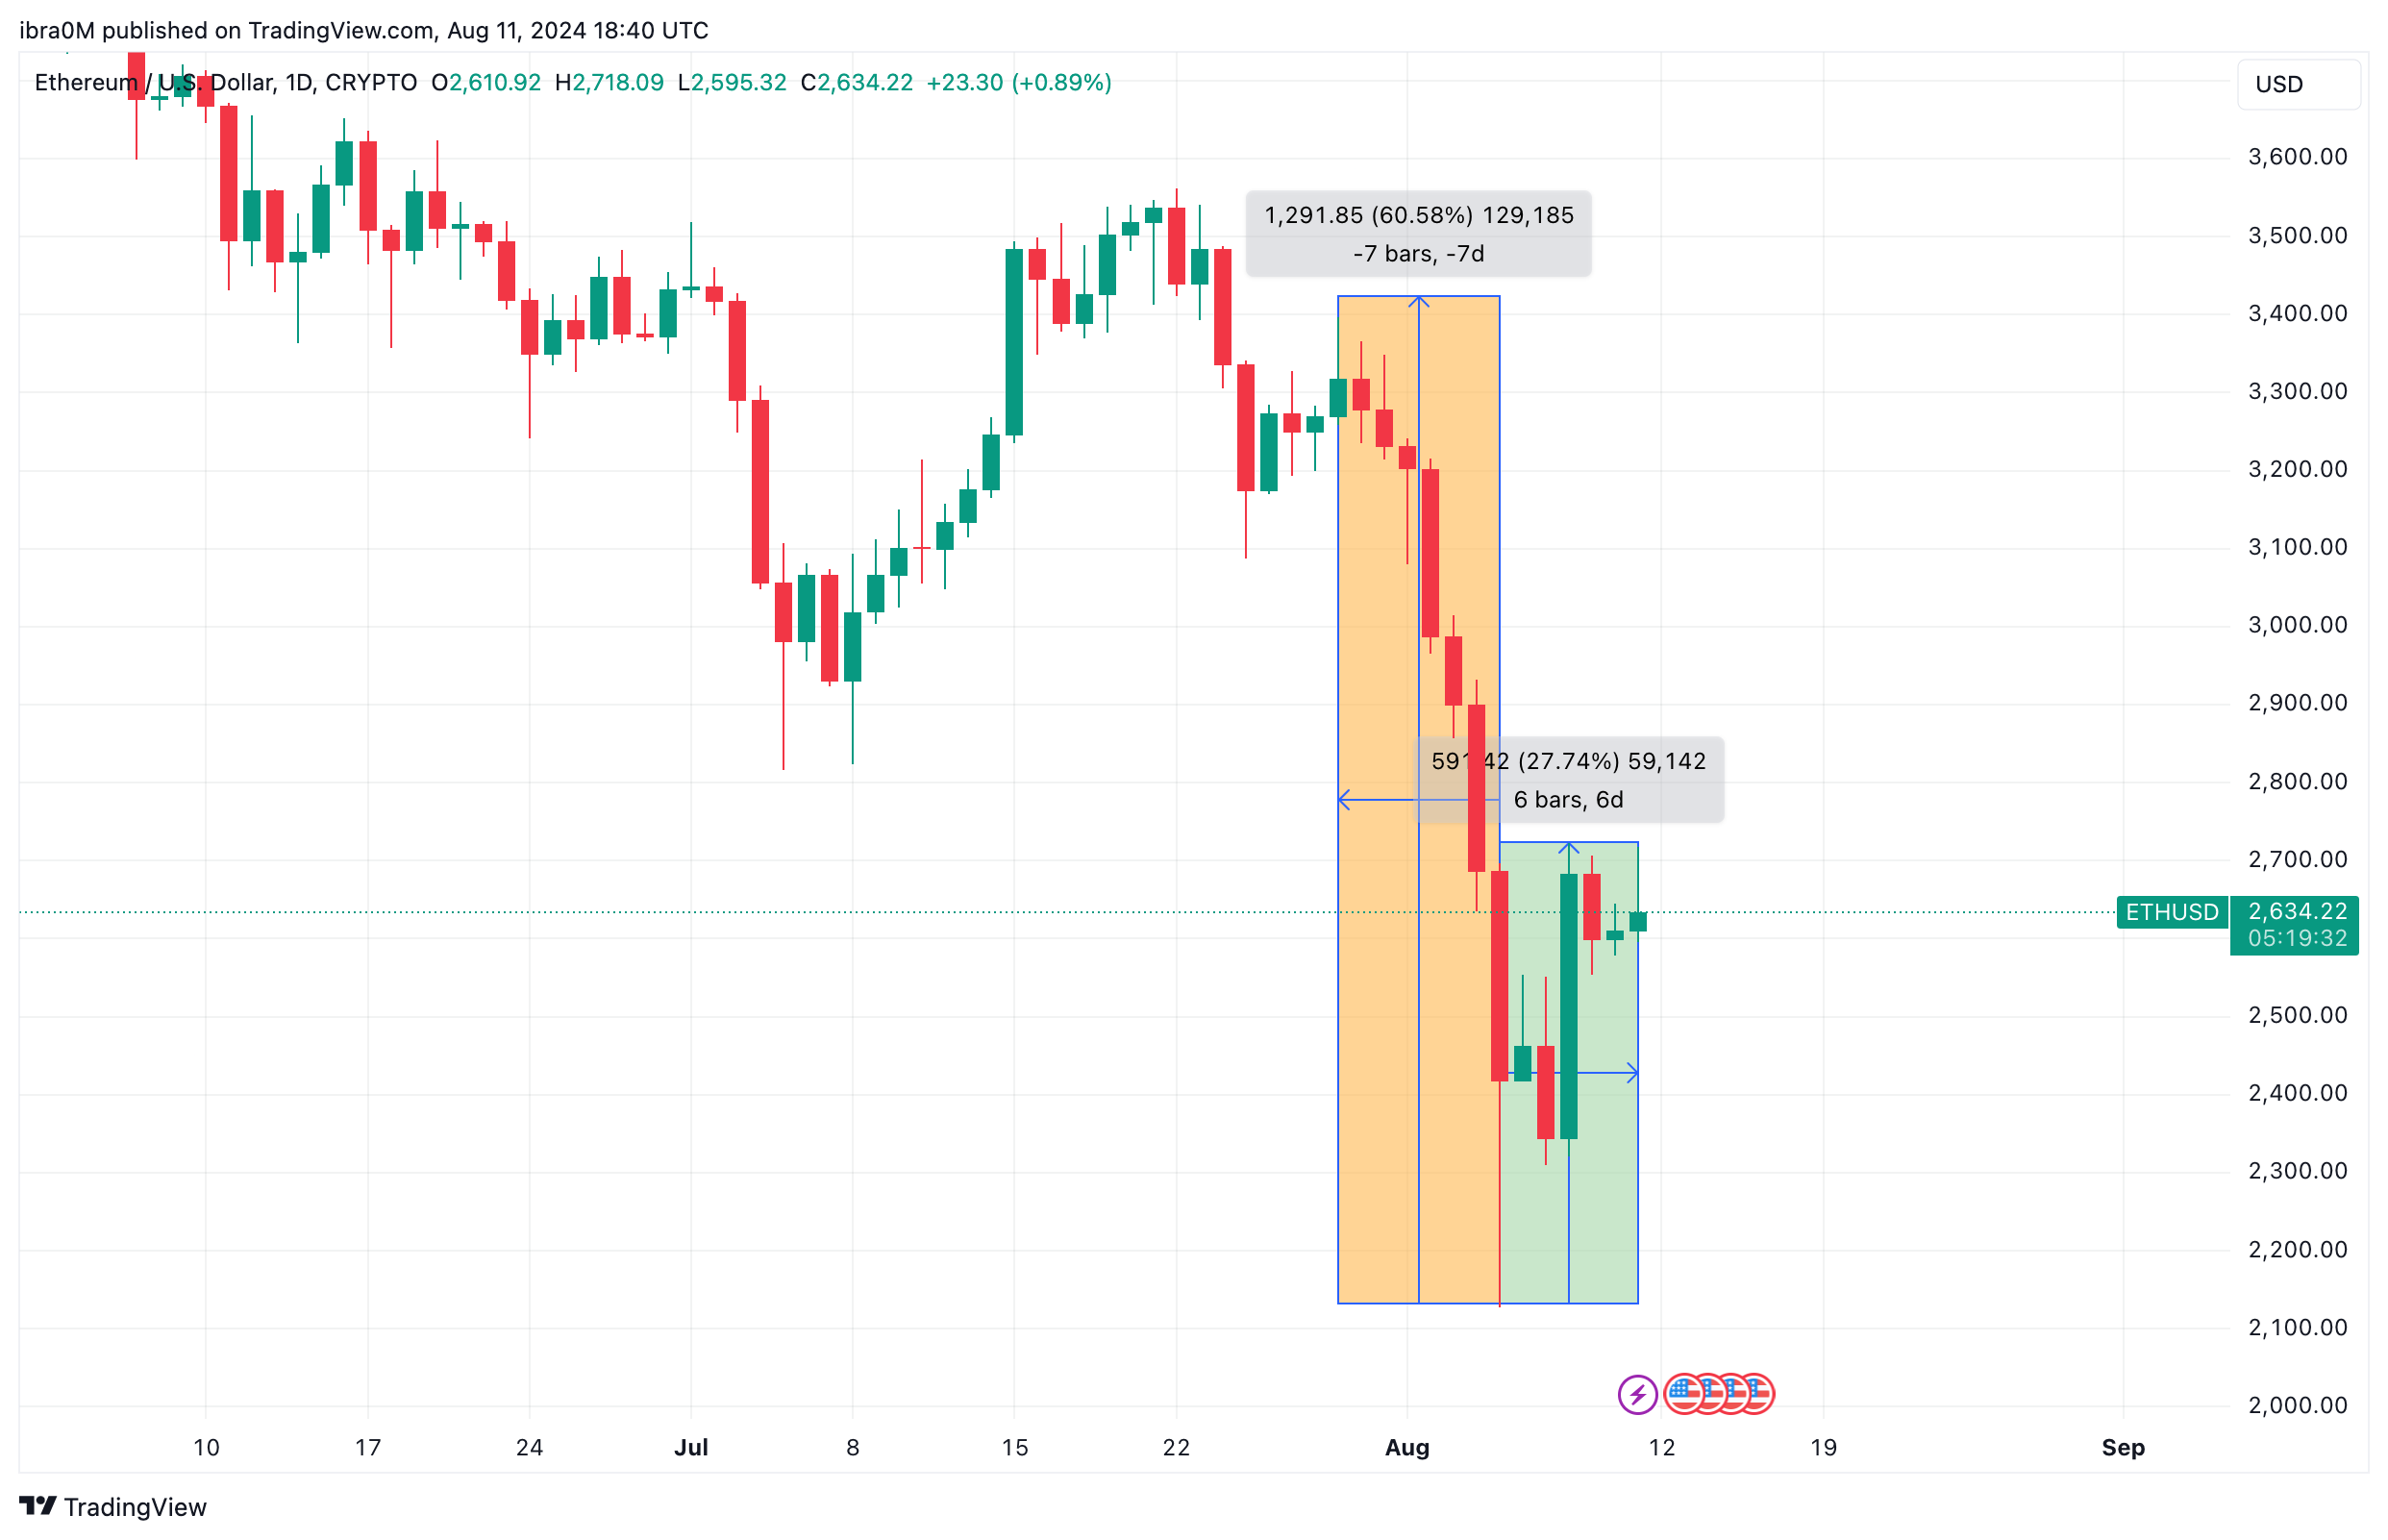
Ethereum’s 27% price surge from $2,120 to $2,710 within the weekly timeframe was a clear reflection of this improvement in market sentiment.
However, despite these bullish drivers, Ethereum hit a significant resistance at the $2,700 level on August 11. This price point acted as a psychological barrier, and the rally lost momentum.
On-chain data suggests that investor sentiment did not fully align with the regulatory optimism, raising concerns that the rejection at $2,700 could lead to a prolonged corrective phase.
Ethereum Price Forecast
Every new Ethereum analysis as it publishes, today's technical signal and key levels, live price — on one page.
See all Ethereum forecasts1. Investors Made Highest ETH 2.0 Withdrawals Since May
The fading momentum in Ethereum’s rally became evident in the last 48 hours leading up to August 11. The initial excitement over regulatory developments began to wane, signaling that ETH demand may now be failing to keep pace, with rising market supply.
This was further corroborated by on-chain data from the Ethereum Beacon Chain, which showed a significant uptick in staking withdrawals.
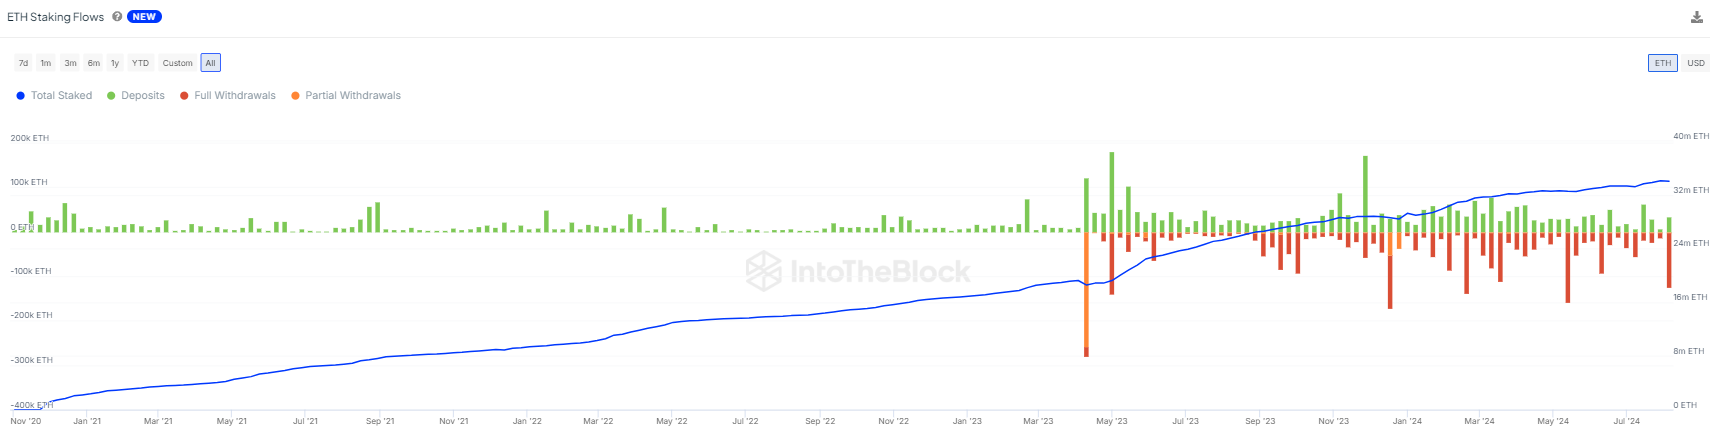
Over the past week, investors withdrew more than 122,000 ETH (~$321.5 million) from ETH 2.0 staking pools—the highest since May. This large-scale withdrawal points to an increase in short-term market supply, which could exert downward pressure on prices in the coming days. The failure of bullish regulatory news to stem this outflow suggests that investor confidence in Ethereum’s immediate prospects remains shaky.
2. Ethereum ETFs AUM is Down $1.89B in August
In parallel, Ethereum ETFs also faced headwinds. Between August 1 and August 11, the total assets under management (AUM) for Ethereum ETFs plummeted from $9.16 billion to $7.27 billion, marking a significant $1.89 billion decline.
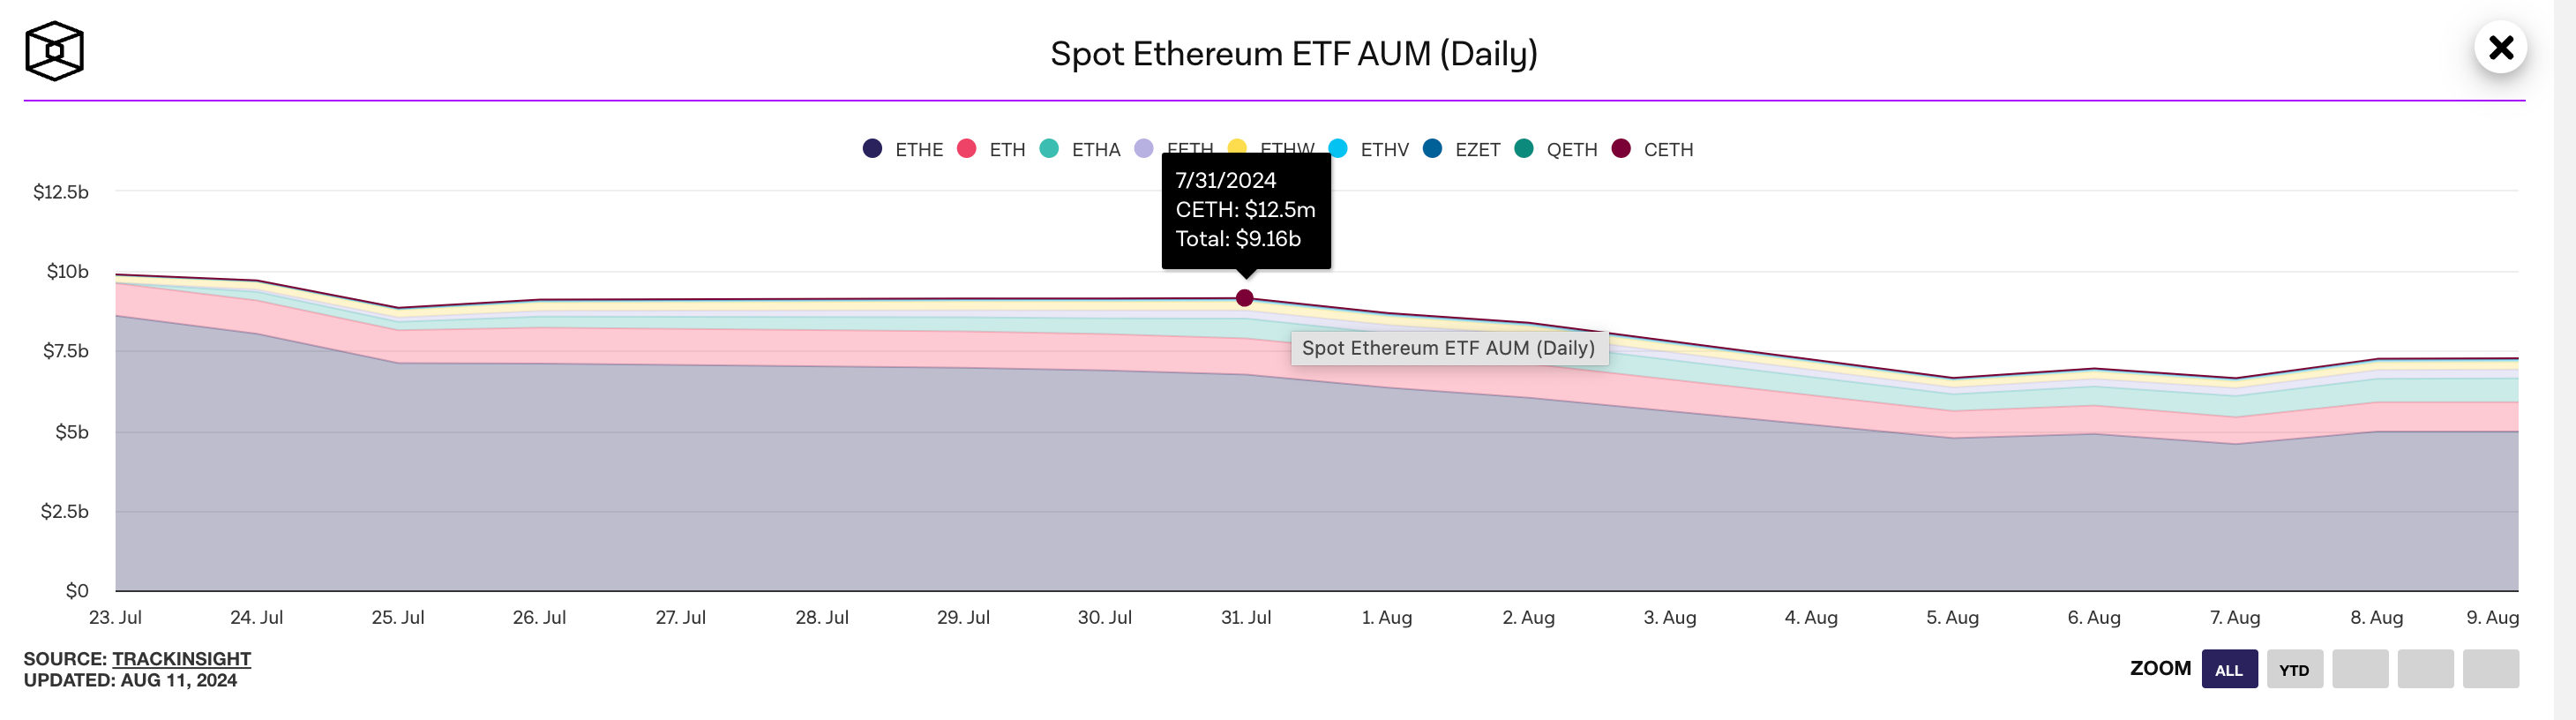
This contraction highlights the challenges that Ethereum faces in maintaining investor interest, even amid favorable legislations observed in the Brazil, USA and Russia last week. The persistent ETH ETF outflows could form another major bearish catalyst for ETH’s price in the week ahead.
3. ETH Price Forecast: Technical Indicators hint at $2,600 Reverse
Technical indicators add further weight to the bearish outlook for Ethereum in the near term. The Parabolic SAR indicator, which is used to identify potential reversals in market trends, has recently flipped to a bearish signal.
Additionally, Ethereum is currently trading near the upper band of its Bollinger Bands, a technical indicator that measures volatility. Trading near this upper boundary typically indicates that an asset is overbought and could be due for a correction.
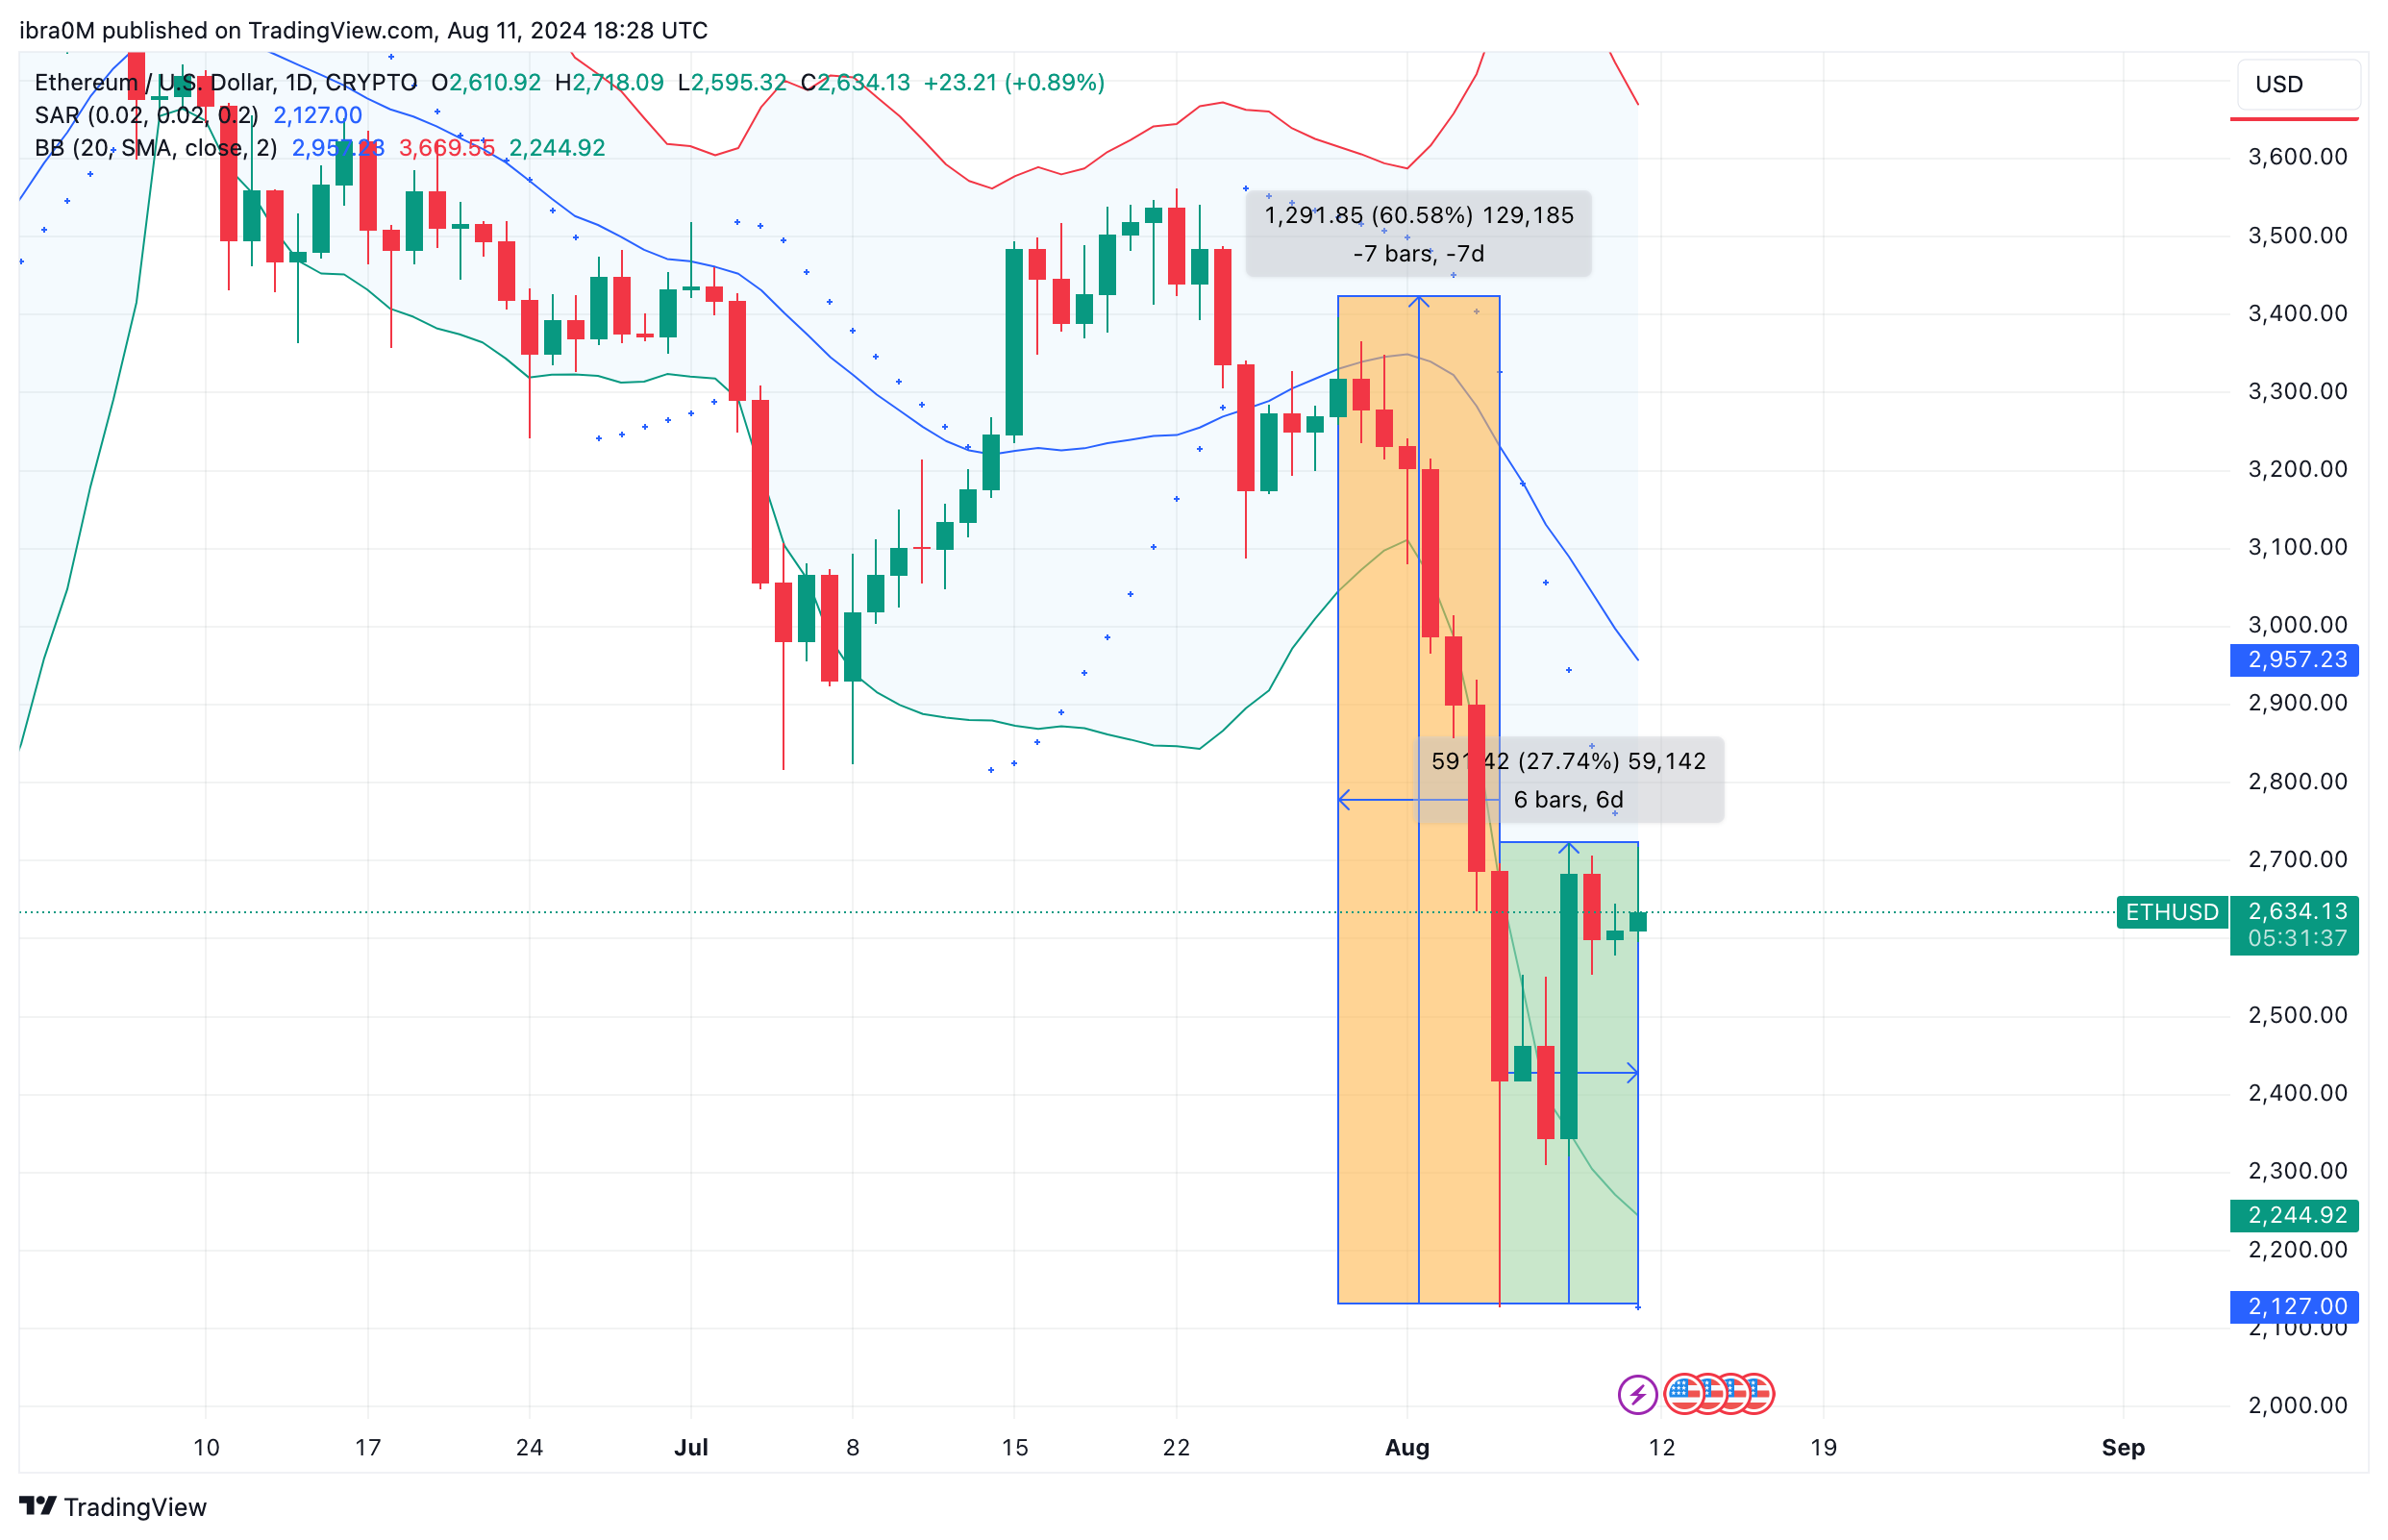
Should Ethereum fail to reclaim and hold above the $2,700 resistance level, the first major support level to watch is at $2,600. A break below this threshold could precipitate a further decline towards $2,400.
In summary, while Ethereum’s initial rebound was fueled by optimistic regulatory developments, the subsequent rejection at $2,700, coupled with significant staking withdrawals and declining ETF AUM, suggests that the market may be bracing for a period of consolidation or further correction.
Investors and market participants should closely monitor the $2,600 support level, as a breach could signal a deeper retracement in the coming days.